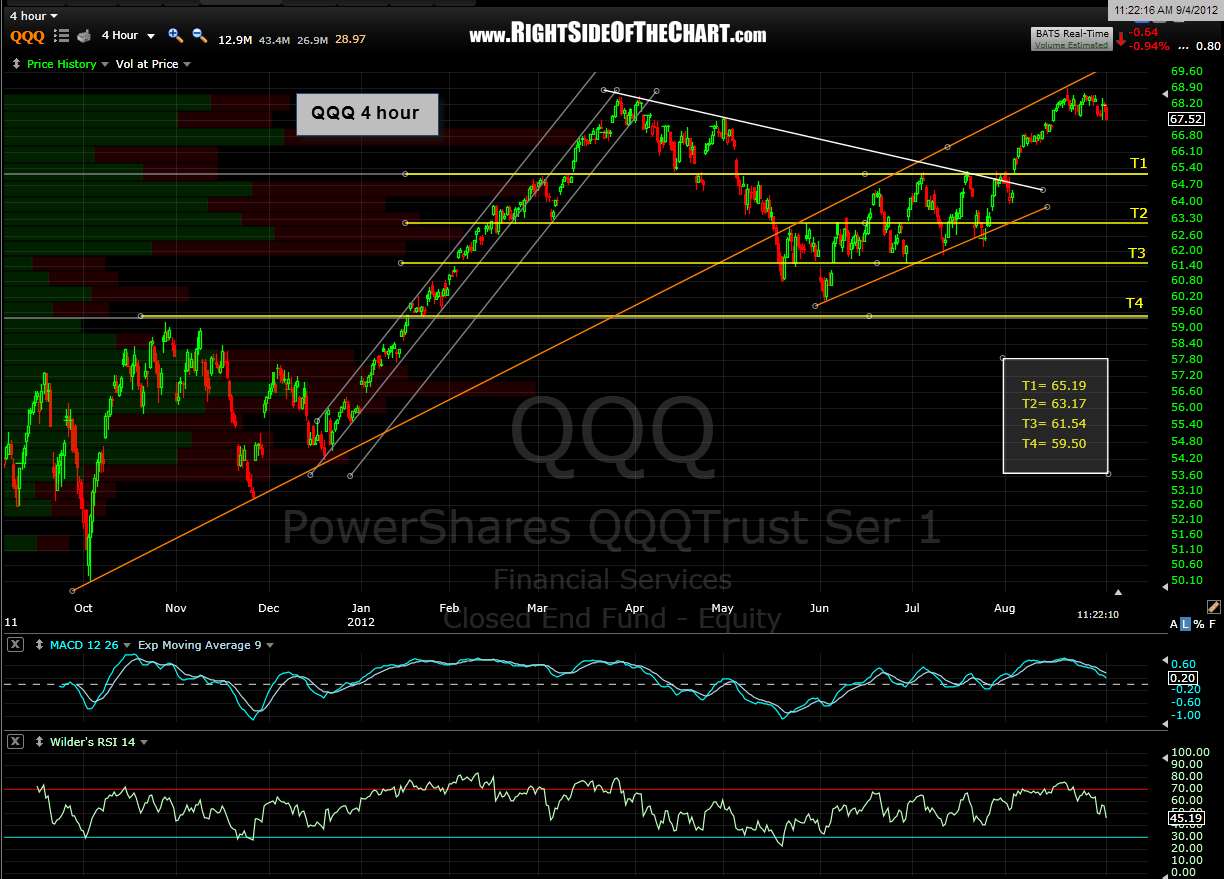
it’s been a while coming, as i first pointed out this ascending broadening wedge pattern in the QQQ on the 4 hour time frame back on august 23rd. at that time, prices had just made the third tag (we usually get 3 tags on the top of the pattern) which turned out to be a golden shorting opp (shown on the first chart below). i’ve also included the previous and the updated 4 hour QQQ chart which shows that prices are starting to break below the pattern, thereby giving an official sell signal or second shorting opp (one could also wait until shortly before the close today in order to make sure this isn’t a fake-down).
coincidentally or not, the price target on this pattern (base of the wedge) lines up with T4, the final intermediate target that i’ve had listed on the Q’s for months now (which btw, i had based on price support and other variables, not the pattern projection).
if this breakdown today sticks, my expectations are that the Q’s find some support on T1 (pause or a bounce), very little, if any support on T2 (maybe a bounce, more likely we slice thru it) and then the odds of a bounce start increasing again at T3 and go up considerable if/when we reach the T4 area where i will most likely reverse from net short to net long, assuming the chart confirm at the time. longer-term swing traders need not be overly concerned with the earlier targets while more active traders might find them useful in micro-managing positions.
p.s.- there was about a 25-30 minute delay in getting this post out due to my internet going down right before i completed it. that breakdown is now pretty solid and the odds of a fake-down are minimal IMO.