
My market updates have been light, or pretty much non-existent since the last update nearly a week ago. At that time, it was pointed out that the Q’s were at key downtrend line resistance and would likely reverse from there. The Q’s struggled with that trendline resistance for days (hence, nothing new to post) but after failing on multiple attempts to break above the trendline, the $NDX finally gave up and started moving lower yesterday as per the previous primary scenario. One thing that stands out to me on this chart is how well prices have acted off the previous target levels, both the initial downside targets (T1-T4 in white) as well as the more recent bounce targets (T1-T3 in blue). Since hitting the final bounce target back on April 22nd, prices immediately reversed and pulled back to the former T2 bounce target, where they bounced sharply. From there prices moved sharply lower to find support on the former T1 bounce target, then moving sharply higher to finally stall out at the previously highlighted downtrend line resistance.
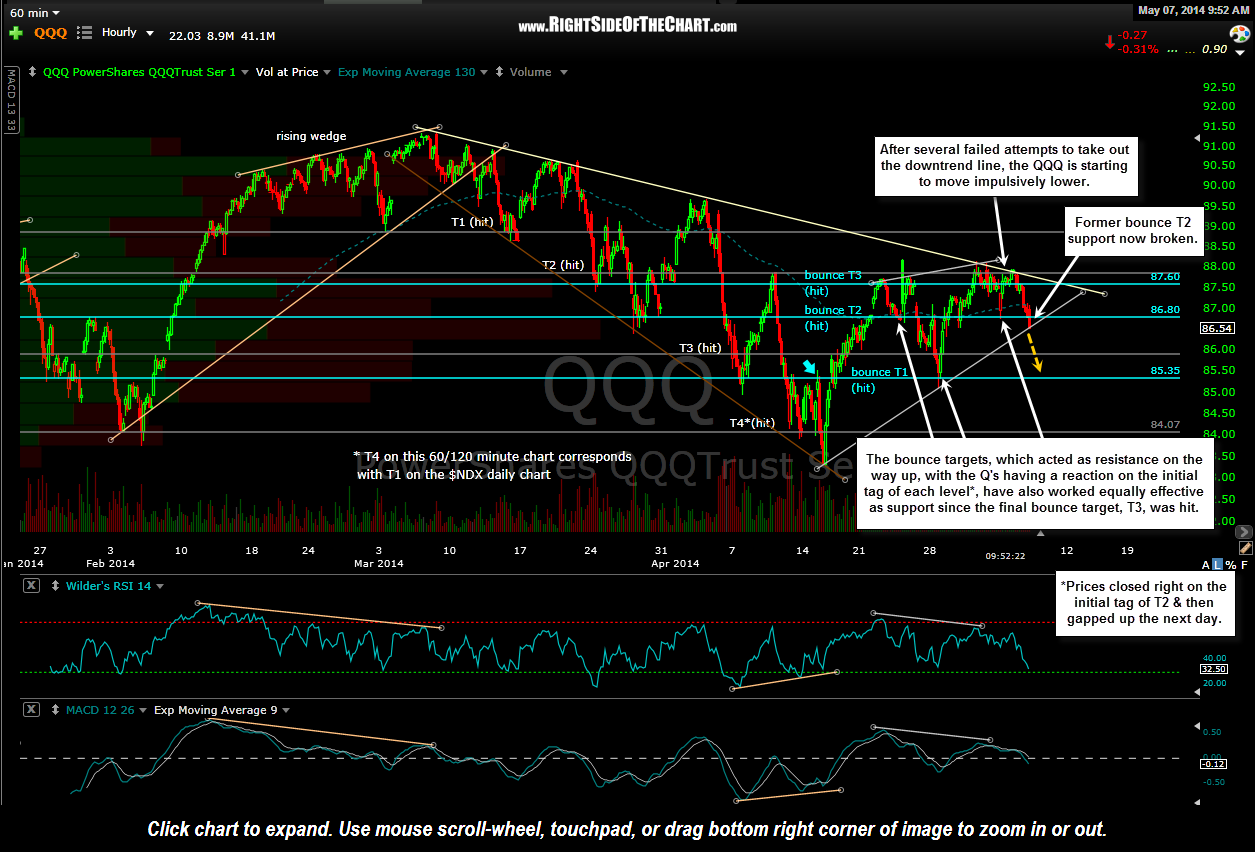
QQQ 60 minute May 7th
As of today, prices once again have broken below the T2 bounce target support level which opens the door for a move to at least the former bounce T1 level. From a longer-term perspective, I favor a break of the April 15th lows (which was the first downside target on my $NDX daily chart) with a continued move to the T2 level on the daily chart which comes in around the 3320 area on the $NDX. Click here to view the live daily chart of the $NDX.
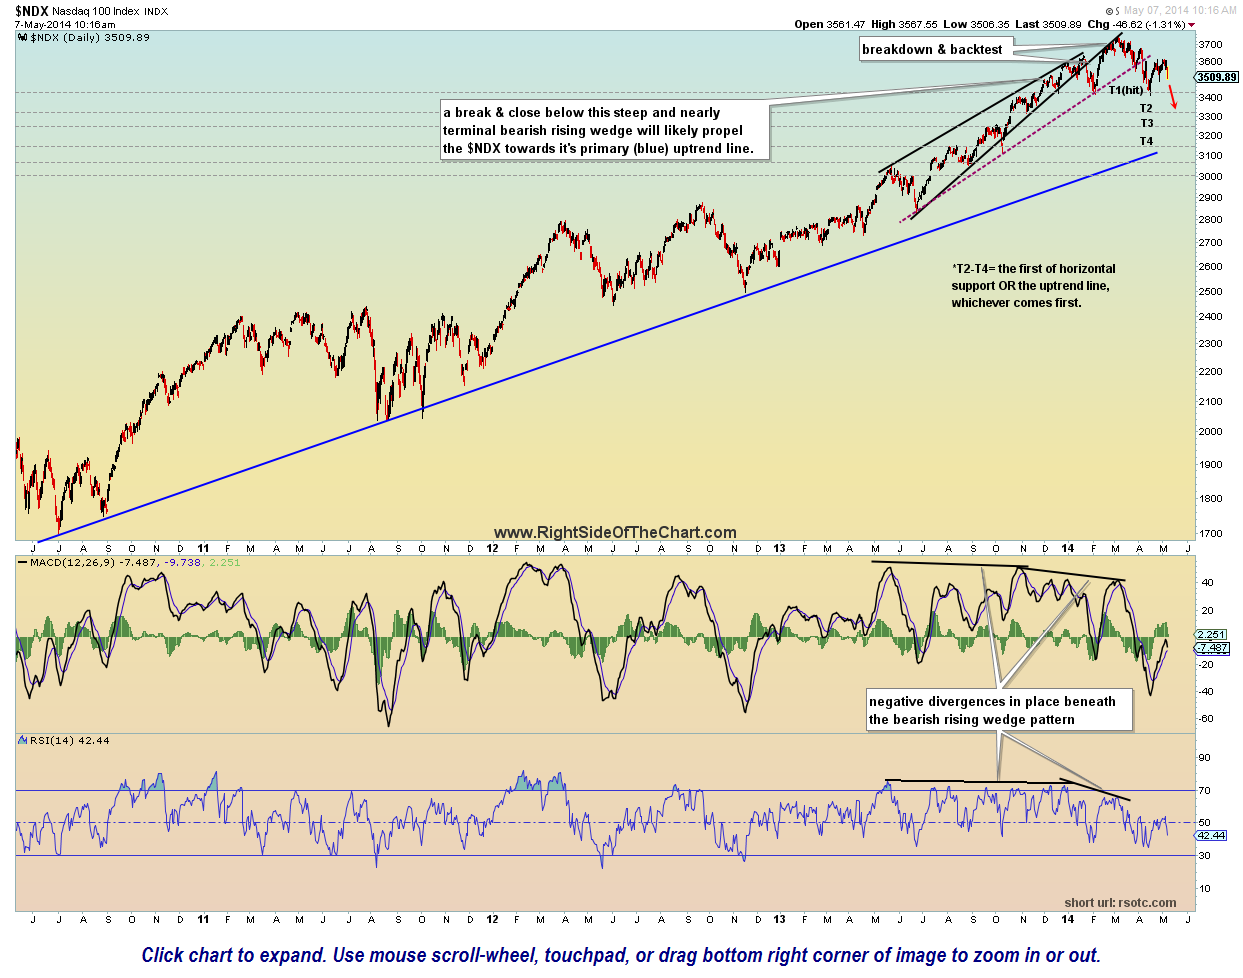
$NDX daily May 7th