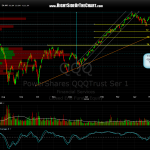
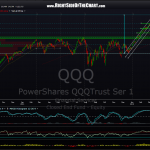
FYI- T3 on the QQQ 4 hour and daily chart was hit at the close today (targets were the same). daily charts are in order as posted with the updated daily and 4 hour charts last.
one of the reasons that i like to post the string of chart is for educational purposes. it gives a visual representation of how a trade, or in this case, a market top (both really) has played out. on the QQQ, as well as the other primary indexes, the top was not easy to nail. as you can see from the first couple of chart, that after this short entry, although based on a solid, technical breakdown/sell-signal, the market made one additional thrust higher. market tops are never easy for the bears to catch or the bulls to get an nice exit on their longs. that thrust to new highs did what the market usually does before a meaningful correction or top and that is to shake out the shorts and suck in as many longs as possible before turning lower.
i will spend some time this evening reviewing the charts for possible additional targets on the downside as well as trying to identify where and when to reverse from short to long, as i often like to do when my final targets on the markets are hit. as of now, that reverse level (long to short) remains T4 on the QQQ chart below, especially if it coincides with my SPY & IWM targets being hit around the same time. however, there are times when the turn is a little more difficult to call in which case i will have scaled out of the my positions (gradually moved to cash) and stay that way until the next direction is pretty clear from a technical perspective. in fact, i did cover my TNA swing-short at the bottom of that IWM 60 minute target zone shortly before the close but i still remain heavily short for now.


