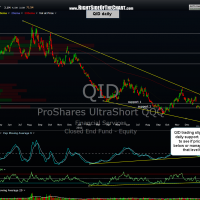
Regarding the active QID trade, the etf is currently trading at 27.26 vs. the suggested stop on the trade of 27.38. This trade was entered one week ago with a very tight stop criteria (1 1/2% downside if stopped out) and so I wanted to point out that QID is currently trading below the previously suggested stop level. Since this trade was posted along with the daily time frame charts of QID showing both the potential longer-term bullish falling wedge pattern as well as the daily Inverse Head & Shoulders bottoming pattern, I will wait until the end of today to make sure that we get a daily close below the 27.38 level.
Remember, every trader will have different price target and stop parameters on the trade ideas posted here. Longer-term traders should consider that these daily patterns are still well intact (at this point) and more importantly, the QQQ is still just shy of it’s post November peak of 67.79 which was made back on Jan 23rd. Currently the QQQ is trading at 67.73 so any close above the 67.79 level today would be a new 2013 closing high for that key etf, a bullish event. Even on a marginal new high in the $NDX, these bearish daily patterns would still be intact but as I often discuss, trading the broad market, especially counter-trend trades, is much more difficult that trading individual stocks. For example, this QID trade is now down 1 1/2% since entry a week ago while only one of the last 5 individual short trades (FB, DAL, OSTK, TASR, NTRI) added are at a loss (DAL is only slightly underwater and OSTK is trading exactly at the entry price of 9.06…all the rest are profitable). There are a few active long and short trades that I plan to update later today or over the weekend as well as a few new setups that I might add to the trade ideas. As far as QID, even though longer-term traders might want to give it some more room, it will be removed on any close below 27.38.


