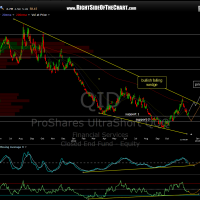
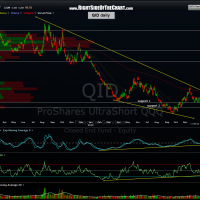
First chart below shows the QID scenarios posted two weeks ago today. Prices today are basically where they were back then with QID still bouncing off that support (S1) level. Not by chance, that level coincides with the 3030-3040 resistance level on the $COMPQ and the 1430-1440 level on the $SPX, both of which are also being challenged today. As back then, if these levels are taken out then the alternative scenario then becomes the primary scenario, as prices on QID are likely to fall to the next support level (S2).
Something that jumped out at me when revisiting this chart today was how any move down to the S2 level within this large bullish falling wedge pattern on the QID would also set up a nice, symmetrical inverse head and shoulders bottoming pattern. Symmetry is not absolutely mandatory with H&S & IHS patterns but does add validity to the pattern and increases the odds that it will play out. The fact that the neckline is slanted is perfectly normal with H&S and IHS patterns. In this case, the neckline is the same as the upper trendline in the falling wedge pattern, another reason to pay this level close attention if QID were to approach it going forward. Original QID scenario (from Dec 4th) followed by the updated QID daily charts showing both of the aforementioned patterns.


