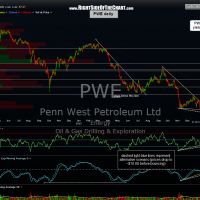
In continuing with my favorite trades, PWE definitely ranks amongst my top picks on the long side. In the previous post on Jan 15th, when PWE was added as both a long setup and a new trade entry, I stated:
Based on my analysis of the charts, I’d put nearly equal odds on one of two scenarios playing out from here: 1) PWE reverses very soon, from at or just below current levels, going on to break out of the falling wedge pattern shown on this daily chart and continuing to move higher over time OR… 2) I could also see the stock continue to drift lower over the next few weeks or so down to around that 10.00 weekly support level, especially if the long overdue market correction takes place. Even if the latter plays out, assuming that support holds, the positive divergences on these time frame would still be intact and this trade would still look promising. Therefore, one might consider scaling into a position of PWE starting around current levels with the intent to add to the position on either a move down to the 10.00 area (with a stop below 9.88 or whatever level is commensurate with your own risk tolerance, trading style and preferred profit target(s).)
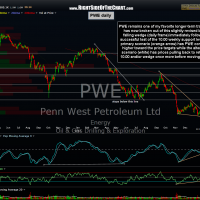
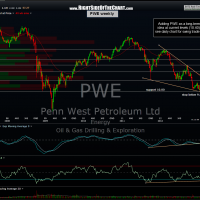
As the updated chart below shows, that second scenario (accidentally annotated as the alternative scenario in the previous chart, as I gave equal odds to both scenarios) has so far played out perfectly. However, we are still way too close to that 10.00 weekly support level to start celebrating. As the broad market remains dangerously overbought with sentiment at bullish extremes, PWE could get dragged back down in the upcoming broad market pullback/selloff/correction or whatever it turns out to be. That does not take away from my positive outlook on this stock as I continue to own it personally and plan to continue to add to the position whether it keeps rising or has one more pullback to re-test that key 10.00 support level (and or the slightly revised falling wedge pattern on the updated daily chart below). Previous and updated daily charts first, then the weekly charts.


