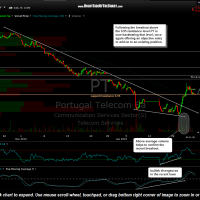
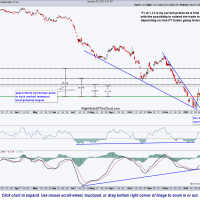
PT (Portugal Telecom) is currently backtesting the 0.95 former resistance, now support level. PT was a long trade idea on Friday on the breakout above the 0.95 resistance level. That break of horizontal resistance followed a break above a bullish falling wedge pattern as shown on the previous & updated (below) 60 minute & daily time frames.
- PT 60 minute Jan 26th
- PT daily Jan 26th
To reiterate, this is an aggressive trade. Although multiple price targets are shown on these charts, my current preferred & the sole official profit target remains 1.14 (about a 20% gain from current levels). Once could either place a very tight stop slightly below the 0.95 support level (e.g.- .92 or .93) or use the suggested stop parameter of 6-7% below entry.
note: On the previously posted daily chart, the 0.95 support line was inadvertently placed a few cent below the actual level. The correct adjustment to that line has been made to the daily chart above which can also be viewed via the live chart link below. The percentage gain measurements to each target/resistance level were also adjusted accordingly.
click here to view the live, annotated daily chart of PT


