
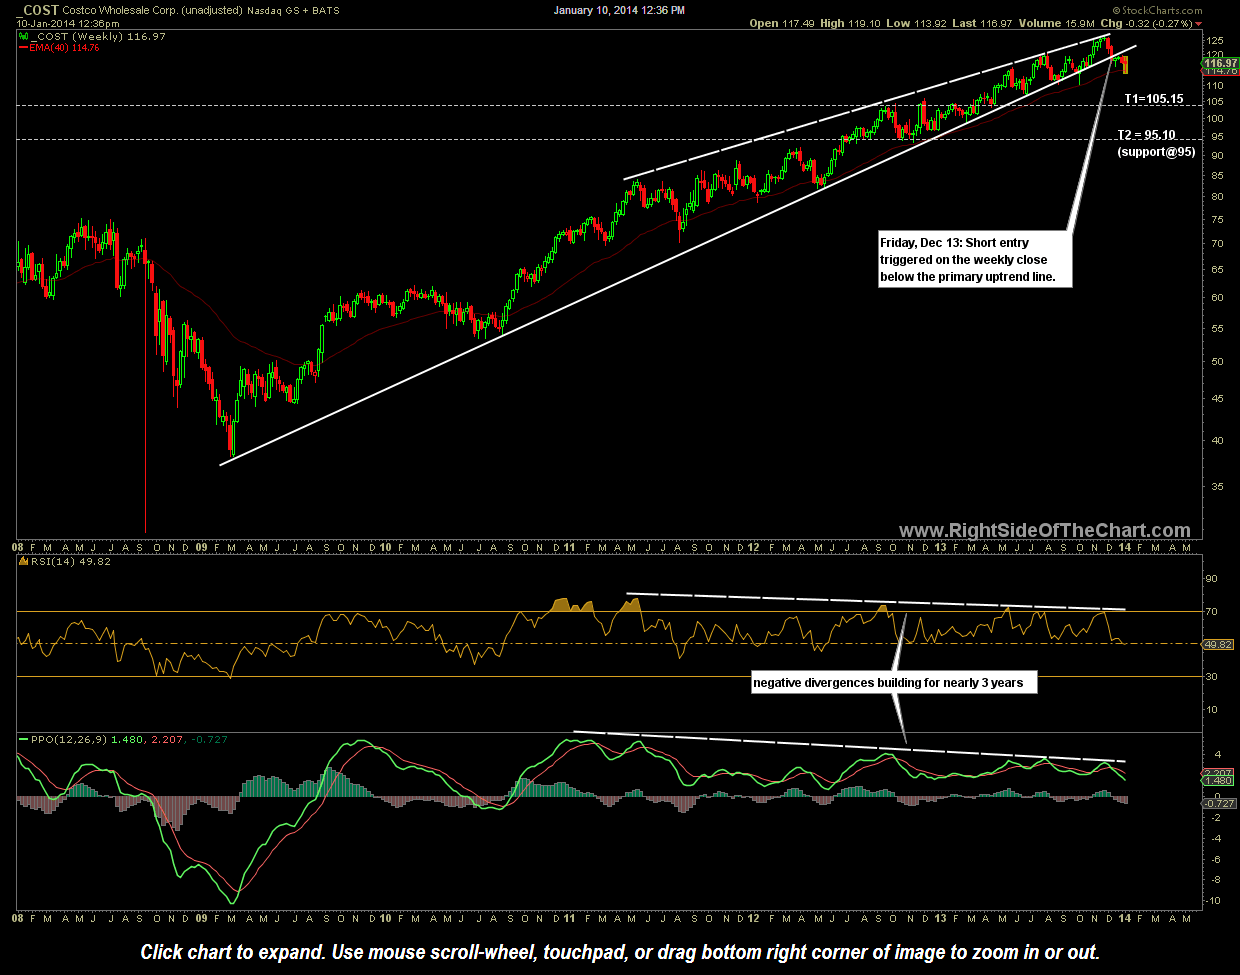
COST weekly Jan 10th
One additional price target has been added to the COST short trade, which triggered a short entry on the weekly close below the long-term uptrend line on the Dec 13th. As COST continued to climb for months before the stock finally printed a weekly close below the trendline (following a few intra-week breaks), the new price target (T1 at 105.15) will be placed just above the first key support level shown on the previous weekly chart with the previous sole long-term swing target of 95.10 now T2, which remains the final target at this time.
As COST is still only trading less than 2% below the breakdown level, this trade still offers and objective entry or add-on around current levels and will remain both an Active Trade as well as a Trade Setup for now. With the broad market trend still bullish at this time, my current preferred target is T1 (105.15), although that may be extended depending on how the charts play out going forward. For those targeting T1, consider a stop slightly above the 127 level or on a solid weekly close back above the uptrend line. A live version of this static updated weekly chart of the COST short trade is now available and can be view by clicking here.