
There’s still nearly two (edit) hours to go (or was when I started putting this commentary together) so things could change before the markets close today but so far, I’m see bearish potential reversal candlesticks being put in on just above every major US index. Potential means just that… we need to see some follow thru to the downside tomorrow and preferably into next week in order to confirm but the fact that many of these bearish candlesticks come with the market so extended and most key indicators & oscillators rolling over (on the daily time frame) should be a caution sign. Best to keep the position sizing on new long-side breakouts on the light-side for now and tighten up stops to protect profits (or minimize losses) on any existing positions. I still have plenty of new trade ideas to share, both long & short, but I’d like to see how the week finishes out before doing much.
 Here’s a look at the QQQ weekly chart with a zoom-in of the today’s daily candlestick overlaid. Notice how this bearish engulfing candlestick comes while prices challenge that uppermost trendline, with solid divergences continuing to persist as the market grinds to new highs on decelerating volume. Also take a look at the MACD and the RSI on the daily chart (not shown here) which are both starting to roll over pretty hard. The daily MACD is poised to make a bearish crossover on any additional downside or sideways action in the QQQ/$NDX while the RSI has just crossed back below the 70 level (which often precedes a pullback). More market charts/commentary to come later this evening.
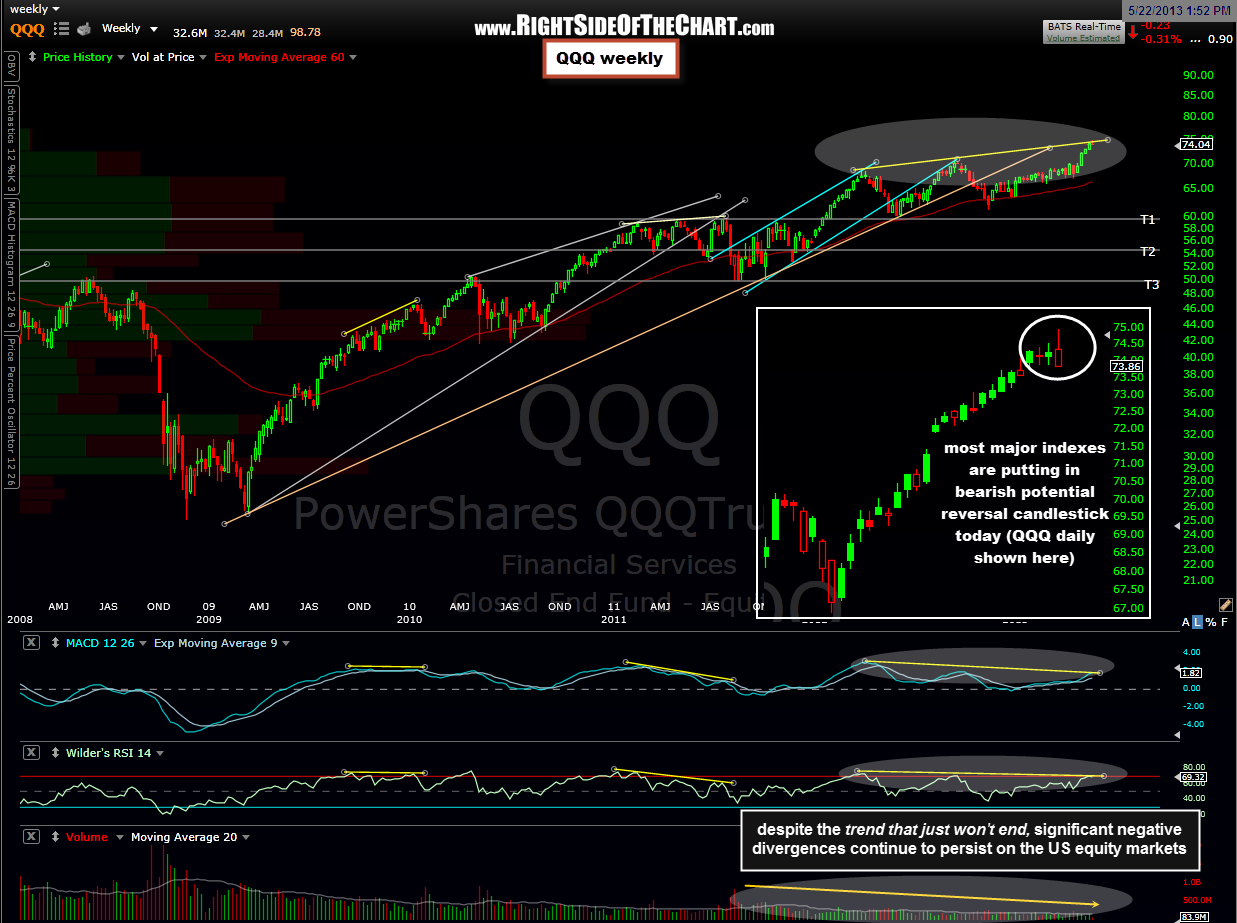