
TEVA is breaking above downtrend line… watching for an expansion in volume as well as a solid 60-minute close above. Also keep in mind the increase in whipsaw signals around the year-end holidays. Also note that prices are now at the 130-ema which could act as resistance. Unofficial trade idea only. Horizontal lines overhead are resistance levels/potential price targets. 60-minute chart:
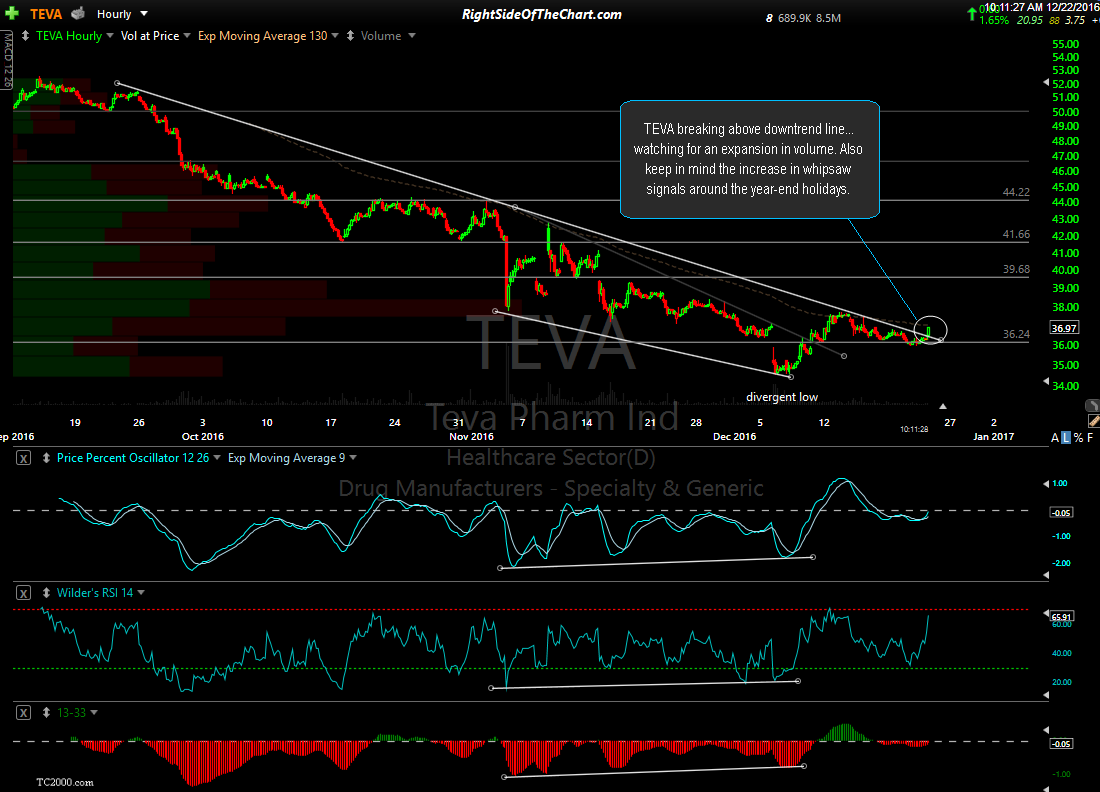
TEVA 60-minute Dec 22nd