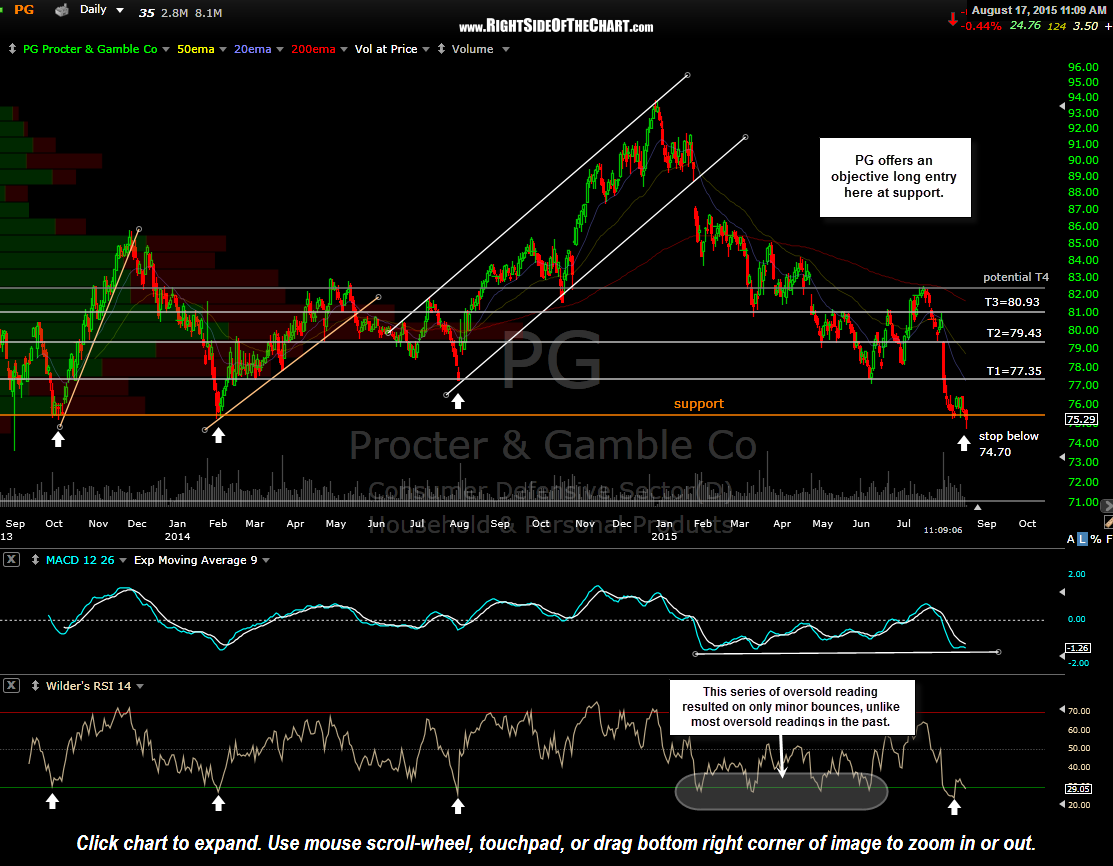
PG (Procter & Gamble Co.) has fallen to a critical support level & appears to offer an objective long entry around current levels. The price targets & suggested stop are listed on the daily chart below.
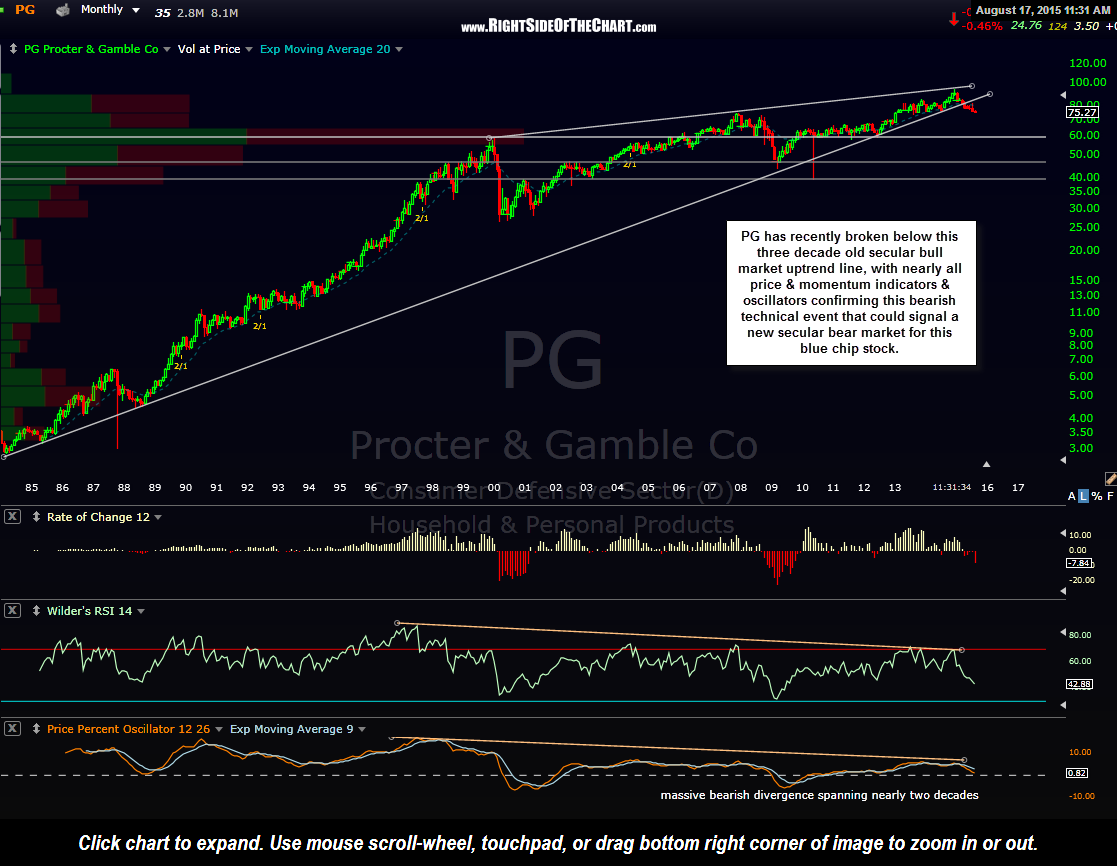
My thoughts on a PG long here are this: From a longer-term perspective, the charts would indicate that PG may have likely embarked on a new secular bear market recently, with this blue-chip stock likely headed to at least the 60 area in the coming months/years (first horizontal support line on the monthly chart). If so, that would represent a drop of another 20% from current levels or about 36% from the recent all-time highs set back in late December.
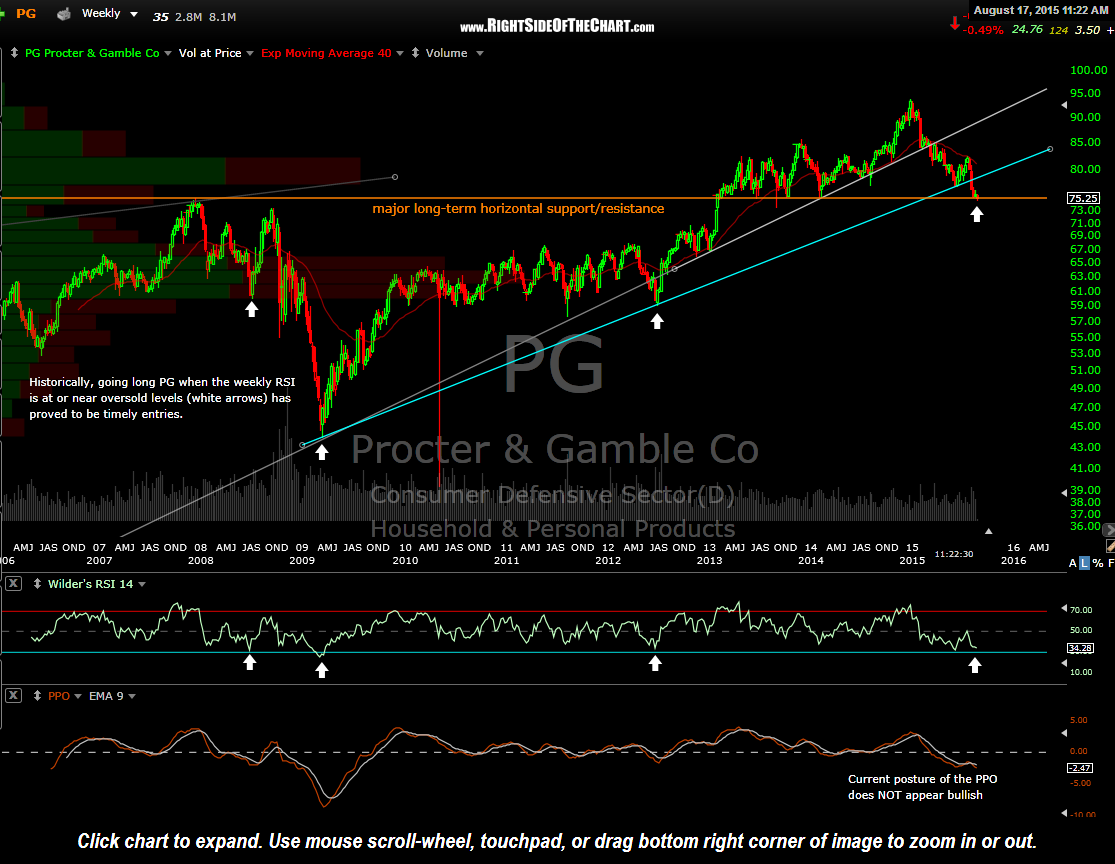
Zooming down to a 10-year weekly chart (below), we can see that other than the recent cluster of oversold readings (at or very close to the 30 level on the RSI), the three previous readings of 30 (or slightly above in 2012) on the weekly RSI have resulted in rallies (trough to peak) of 22%, 54%, & 58% respectively.
Bottom line is this: From a longer-term perspective, it would appear the multi-decade secular bull market in PG may have ended. However, with the stock having already fallen 20% from the peak highs in late December while oversold on the daily time frame AND currently trading at a major long-term support level, not to mention a potential hammer candlestick in progress so far today), it would appear that PG is likely due for an oversold rally. As such, a long entry here with a stop set slightly below this morning’s lows certainly offers an attractive R/R for a swing trade with minimal (60 cents) downside risk compared to about a 4.00 profit potential (to the current final target).


