
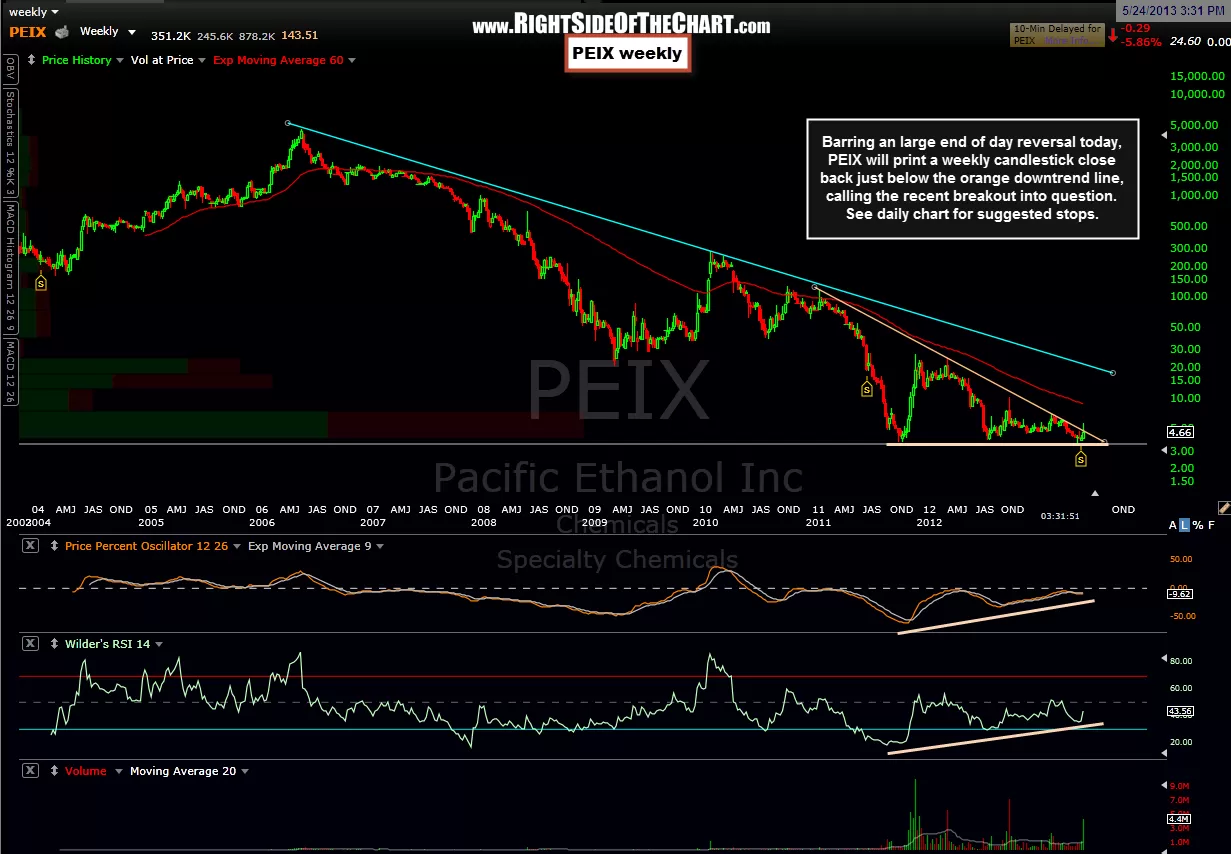
Barring an large end of day reversal today, PEIX will likely print a weekly candlestick close back just below the orange downtrend line, calling the recent breakout into question. Today’s move isn’t far enough below the trendline to cause me to remove PEIX as an active trade & with these small low-quality, high volatility stocks we often see such post-breakout moves back below the break-point to shake out any weak hands before the stock continues higher. With that being said, additional downside in the broad markets remains likely and what tends to happen when the junk stocks start breaking out at the tail end of an over-extended run in the market (especially once the leaders start breaking down) is that the breakout are prone to fail. (note: The previous charts were inadvertently labeled as daily charts, when they were actually 2-day period charts, as the first one below).
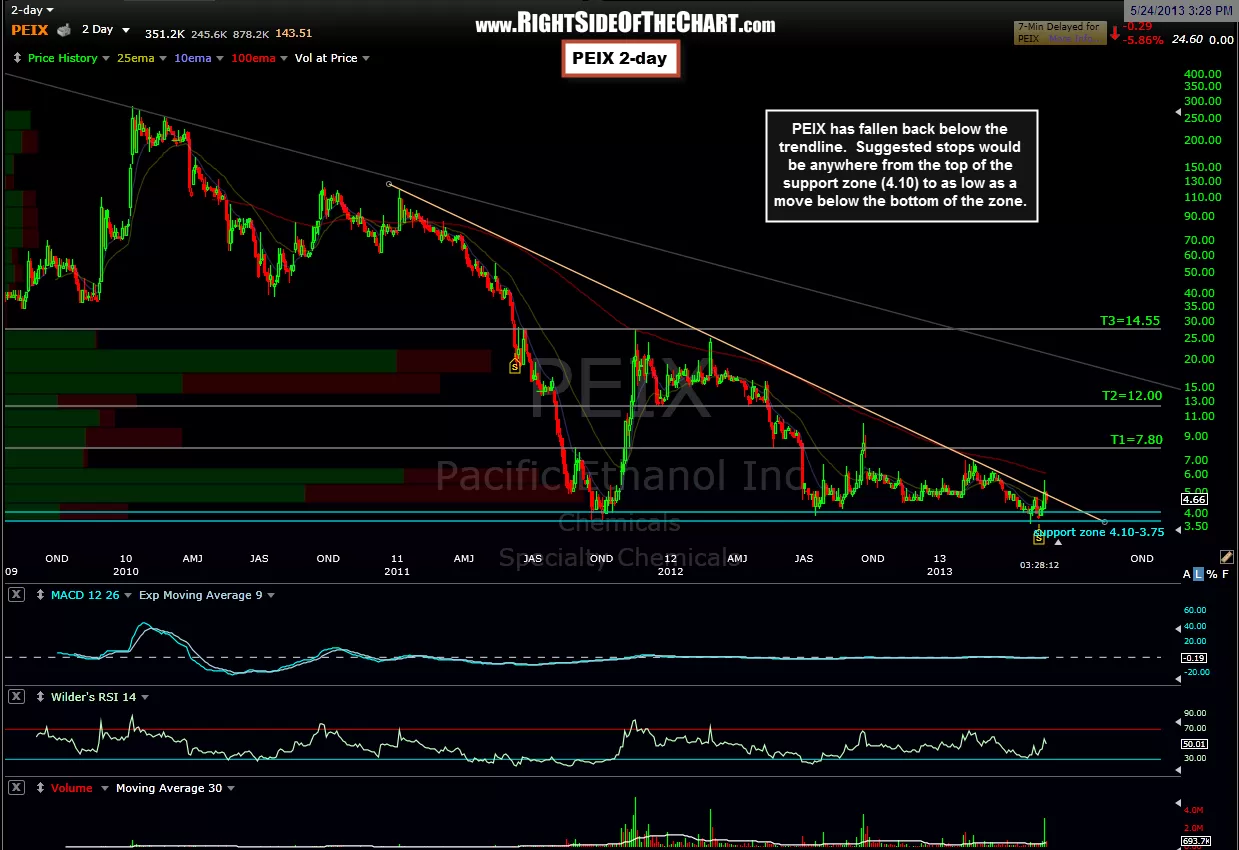
I’ve added a support zone to this updated 2-day period chart. The most objective stops (other than stopping out today, if prices do print a solid close back within the pattern, a common rule for many traders) would be either a stop slightly below the top of the support zone which comes in at 4.10 or a stop below the bottom of the support zone at 3.75. Those levels are significantly below the entry price in percentage terms, however, from a R/R perspective taking into account the potential gains (target levels), these stops are relatively conservative. Remember, this was stated as a very high risk trade will unusually large volatility to be expected. As such, it was suggested to scale down any position taken to a fraction of one’s usual position size. Therefore, any losses or gains on this trade should be roughly commensurate with the expected gains or losses from an typical trade when measured in total value (not percentage).