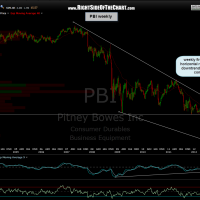
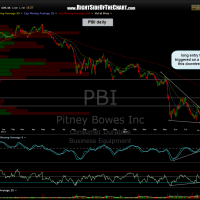
i am adding PBI as a long trade setup as well as a long-term trade (investment idea). shorter to intermediate term swing traders could shoot for T1 or T2 on the daily chart while longer-term traders or investors might hold out for T3 on the daily (17.40) which is also the horizontal line/potential first target on the weekly chart shown below. also note how the stock seems to be forming a very large falling wedge type pattern on the weekly and as with the daily chart, nice positive divergences are in place on the oscillators below. entry would be on a break above the daily downtrend line/wedge pattern.
although dividends can be slashed at anytime, PBI is currently yielding 11%. here’s an article making a bullish case for PBI from a fundamental perspective, which helps strengthen the case for a longer-term trade or investment in the stock. as always, DYODD (do your own due diligence).


