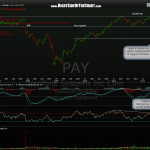
 here’s the weekly chart of PAY. although this directly contradicts the bullish set-up below, there are a couple of points to remember:
1) this is a potentially bearish pattern formation on the weekly time frame with emphasis on the word potentially. until/unless that pattern is triggered, PAY could just be consolidating in a trading range before breaking out to new highs. with that being said, the fact that PAY did put in a double top while both the MACD and RSI put in lower highs (i.e.- negative divergence), plus that very impulsive selling following the recent failure to break out to new highs (the recent large red volume bars), makes me put the odds that this pattern will ultimately break down, not up to new highs.
2) both the bearish weekly (long-term) and bullish daily & 60 minute (intermediate and short-term) scenarios could play out. in other words, PAY could put in a multi-week bounce off that daily support level, hitting one or more of my 60 minute targets before turning back down and going on to break that daily/weekly key support level and playing out as a lucrative short trade. had the weekly chart for PAY looked more bullish than bearish, i might have added this trade to the Long Term Trades section. since it does not, PAY will remain a long trade set-up for now but could very likely be posted as a short trade idea if that key support level breaks down and my view on the broad market is bearish at that time. trading is all about being flexible and the ability to change your bias often very quickly.

