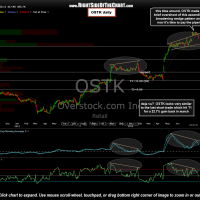
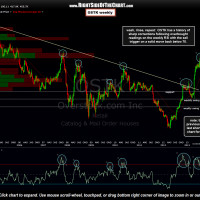
OSTK (Overstock.com) was a short trade earlier this year that hit the first target back in March for a 22.7% gain whereby partial or full profits and/or lowering stops were suggested. The stock bounced from there and was stopped out but the charts have come full circle on this one and once again, we have very similar technical patterns on both the daily & weekly charts as we did back then.
On the daily time frame we have an ascending broadening wedge pattern, very similar to the pattern that was formed back in late 2012/early 2013. As back then, OSTK just recently put in some very steep & pronounced negative divergences on the MACD & RSI as prices made new highs. The first target for this trade is 25.30 with the second & preferred swing target at 18.65. Viewing the weekly chart, also as discussed in the initial post of the last short trade, the RSI has just recently crossed back below the 70 level after spending a significant amount of time in extreme overbought territory.
OSTK is a high risk, potentially high return trade and as such should be only be considered by aggressive traders. As large price swings are the norm with OSTK, a reduced position size is suggested in order to allow for larger than usual stops. A suggest stop somewhat above the recent highs of 35.60 might be suitable if targeting T2 while a considerable tighter stop would be suggested for shorter-term, more active traders targeting T1. Daily & weekly charts:
- OSTK daily Aug 7- Short Entry
- OSTK weekly Oct 17- Short Entry


