Although there are quite a few active trades to update, some of which still look good, others that have exceeded their suggested stop parameters, I’m going to focus my efforts at this time on highlighting some of the more attractive trade opportunities.
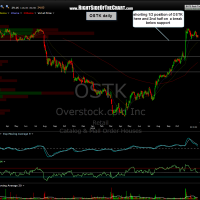
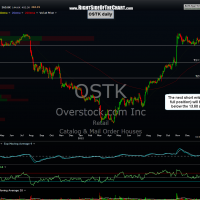
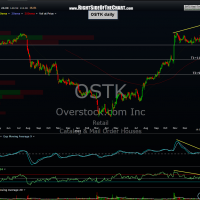
OSTK has been one of my favorite swing trades since the first post nearly two months ago and continues to be one of the better looking trades at this time, still offering an objective entry or add-on to the trade. I’ve updated both the daily & weekly charts and posted them in chronological order with the previous charts. In the original post back on Dec. 7th, my suggestion was to begin a gradual scale in (gradually buying partial position sized lots), allowing for wide stops, and bringing the trade to a full position once the support level on the daily chart was broken. The second update to the trade on Jan 29th was a heads up that prices were close to breaking that support level, which as the most recent charts show, has now happened.
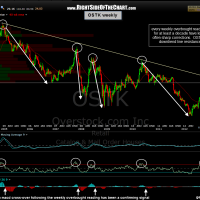
Finally, I also wanted to mention that we now have all three sell signals in place that were discussed in the original post: 1) A cross back below the 70 level on the weekly RSI; 2) A bearish crossover on the weekly MACD (which confirms the weekly RSI sell signal); and 3) A break below the key horizontal support level (not to mention a failure/false breakout at the weekly downtrend line). Check. Check. Check… All systems go for launch.
As even the best looking chart patterns don’t always play out, make sure to adjust your stops according to your preferred profit target(s), risk tolerance and trading style. Assuming that one’s average entry price on the trade is around 14.00 or so, adjusting stops to around the 15.40 level at this point would make sense. Charts in order as posted with the daily charts first, then weeklies:


