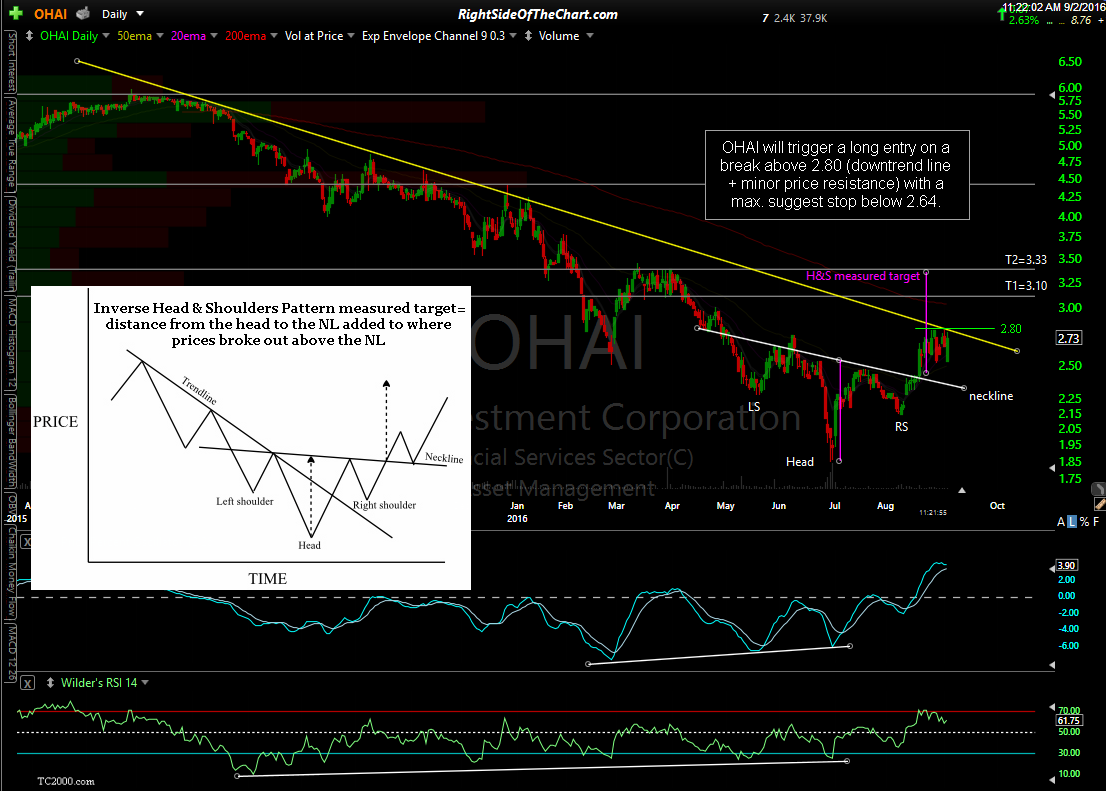
OHAI (OHA Investment Corp) will trigger a long entry on a break above 2.80 (downtrend line + minor price resistance) with a max. suggest stop below 2.64. Price targets are T1 at 3.10 & T2 at 3.33. Due to the low-price, somewhat precarious fundamental position of OHIA as well as the expected volatility going forward, the Suggested Beta-Adjustment for this trade setup is 0.6.
Although I have my concerns about OHA Investment Corp’s ability to maintain the current quarterly dividend of $0.06, as they have reduced the dividend twice since early 2015 (largely due to an over-weighted long exposure to the energy sector, which they have recently been reducing), should the company be able to maintain or even increase the dividend going forward, based on the current yield of 8.8% plus the potential for nearly 19% in capital appreciation, assuming that my final target of 3.33 is hit, OHIA will be added as a Growth & Income Trade Setup in addition to a the typical Long Trade (swing trade) Setup with the same price targets.
From the daily chart above, it appears that OHIA bottomed back in late June on a text-book selling climax, which is typically characterized by a very impulsive move down following a prolonged downtrend, marked by an unusually large surge in volume. That selling climax formed the Head of an Inverse Head & Shoulders bottoming pattern with the trough of the Right Shoulder put in place back in early August. OHAI went on to break above the Neckline of the IHS pattern on Aug 18th & the fact that the breakout was confirmed on above average volume with a very powerful, impulsive move higher that day helped to validate the IHS pattern & the fact that the down-sloping neckline was a significant technical level.
Since then, the stock continued a bit higher & has been consolidating the recent gains while trading sideways, which helps to alleviate the overbought conditions, allowing for a more sustained rally if & when the stock can break out above the top of this recent consolidation range at 2.80.


