

NVO (Novo Nordisk A/S) has hit the first long-term (trend) target on this weekly chart, for a ~20% profit, with the odds for a reaction elevated before the next leg up. Initial (Aug 7th) & updated weekly charts below.
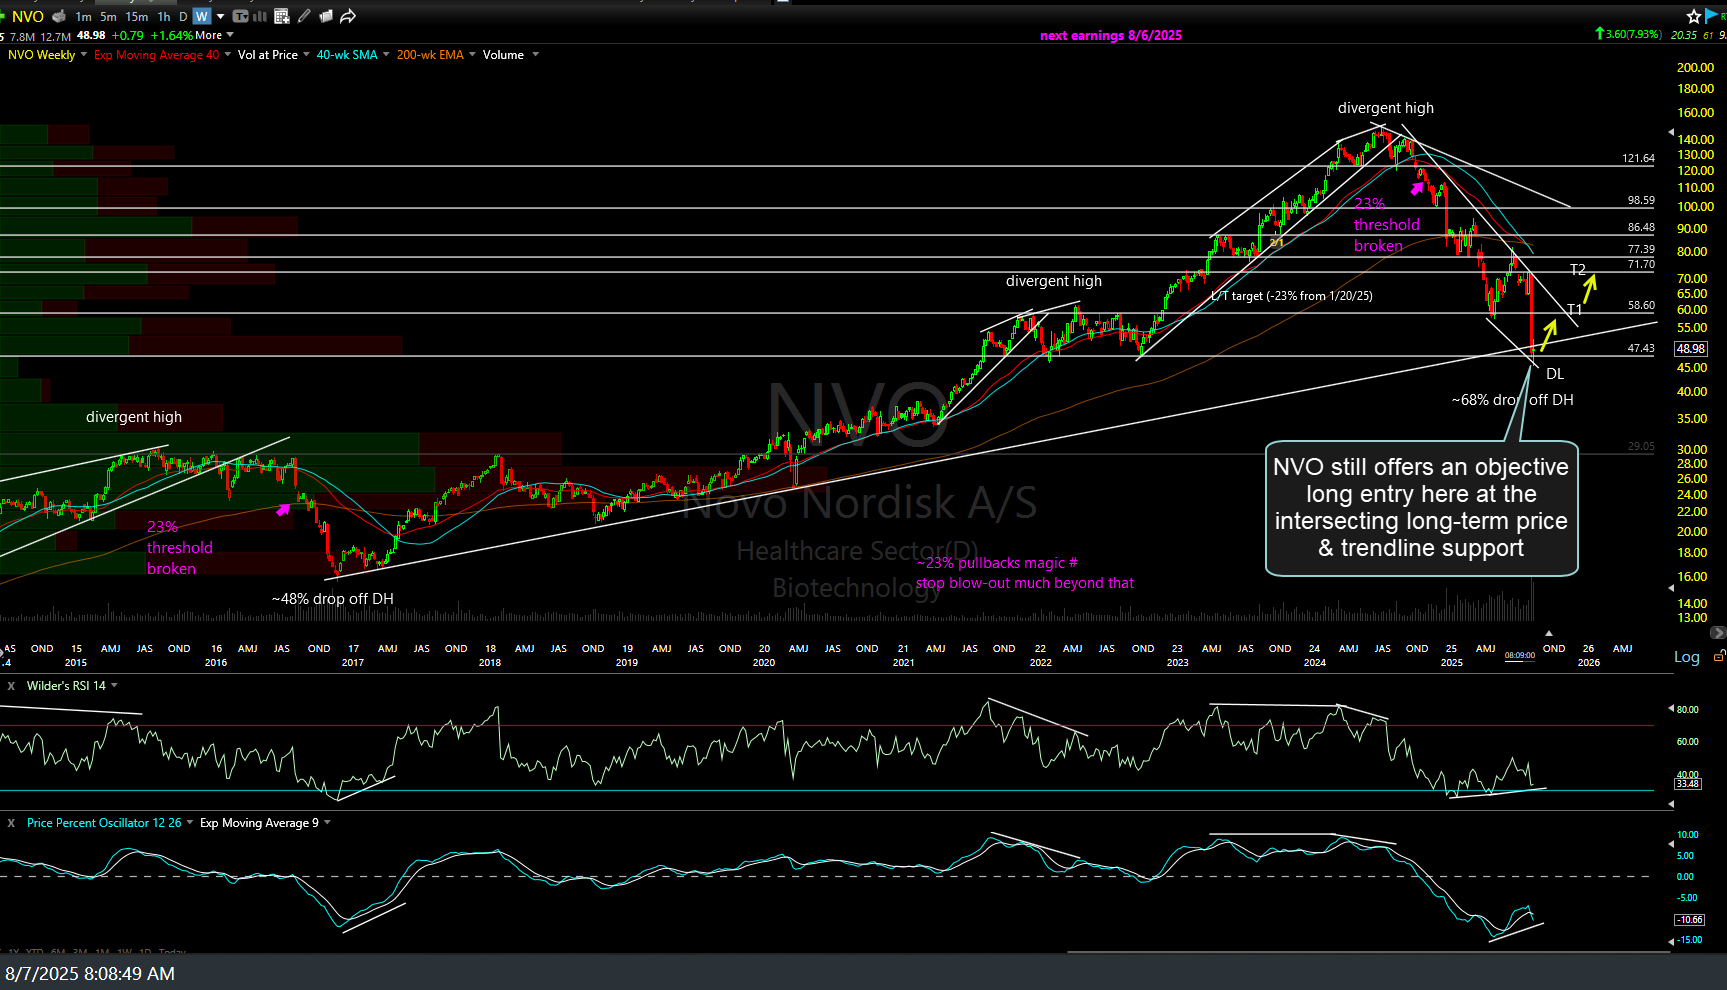
NVO weekly Aug 7th
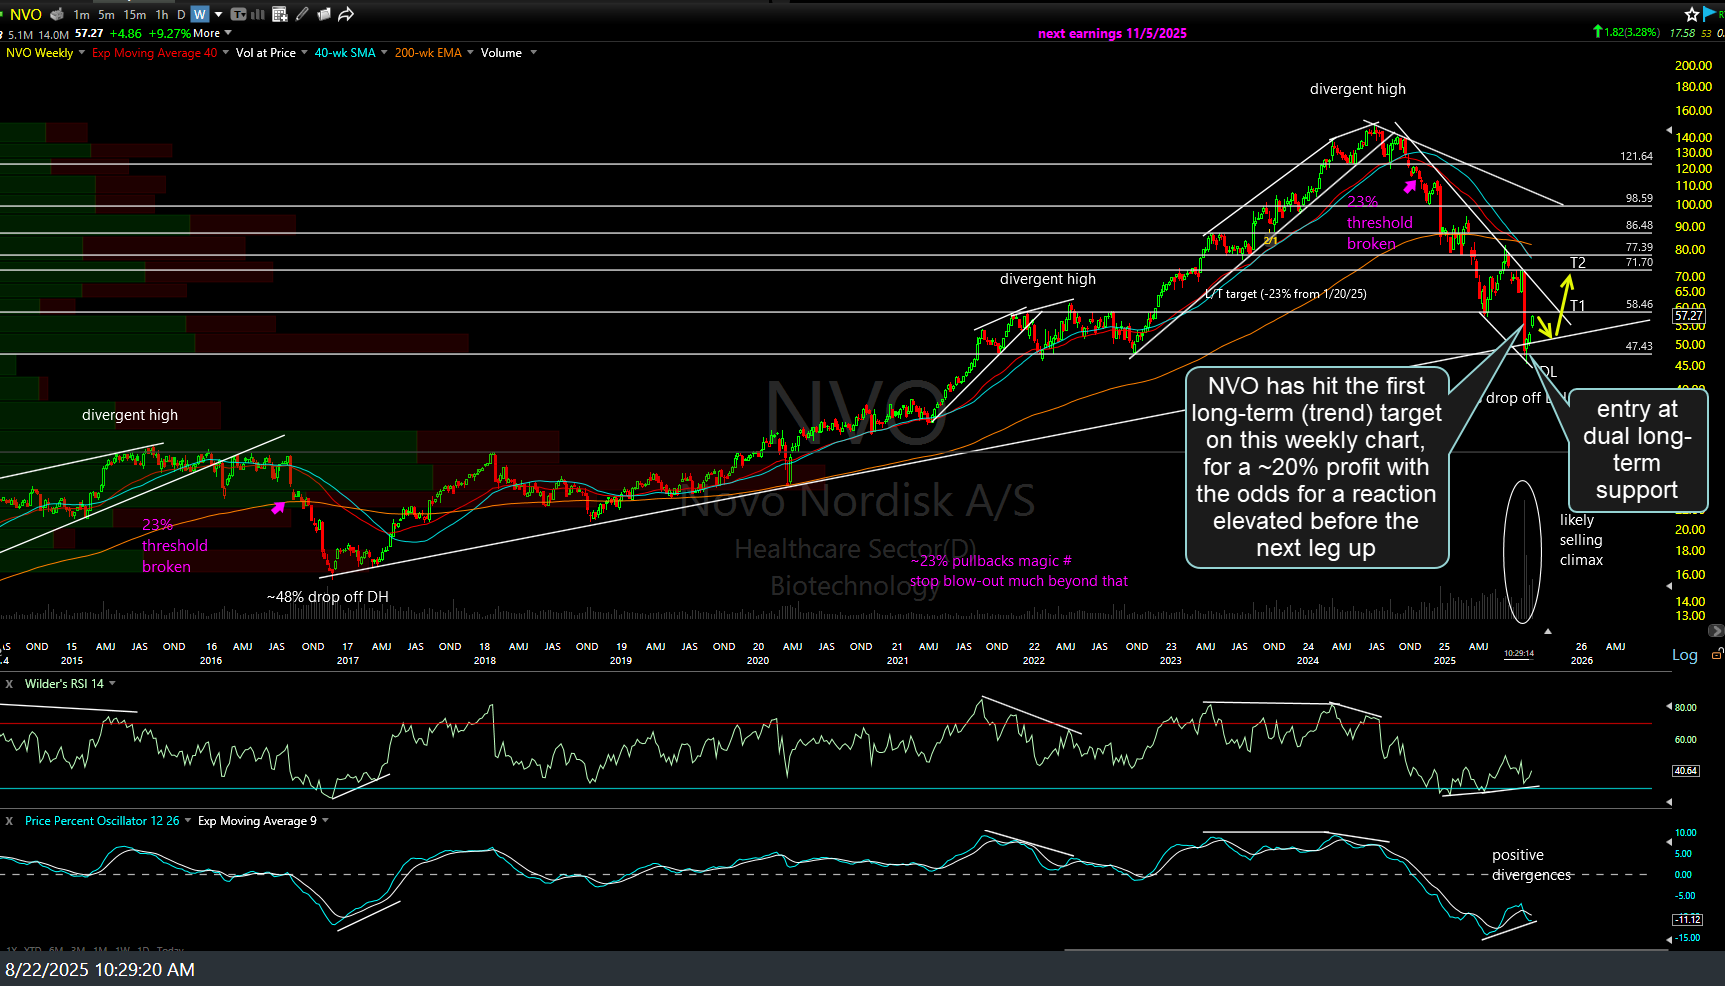
NVO weekly Aug 22nd
Zooming down to the swing trade based on the daily time frame, I’m revising T4 slightly lower (around current levels) to account for the April 17th reaction low, providing a ~20% profit so far with more upside in the coming weeks/months likely, although the odds for another reaction are elevated at this time. Should NVO pull back off this resistance level, a break below that minor uptrend below would likely trigger a correction back to any or all of the previous price targets (T1–T3), thereby providing an objective re-entry or add-on to an existing position. Updated daily chart below.
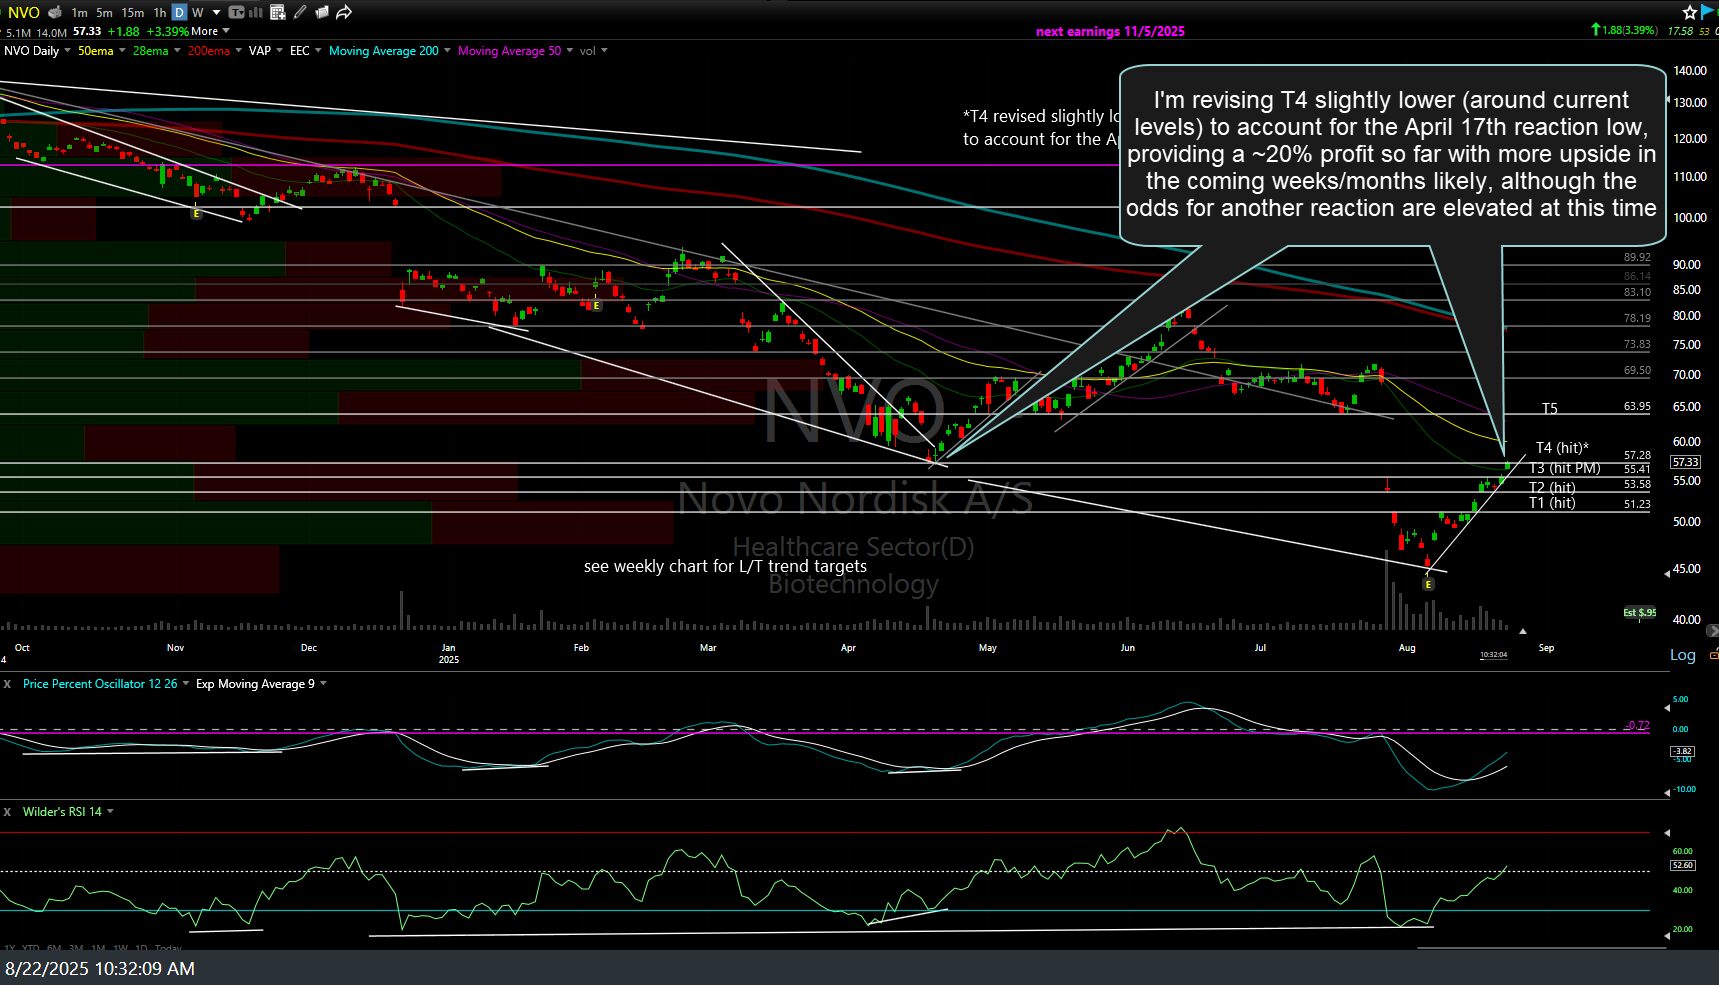
NVO daily Aug 22nd