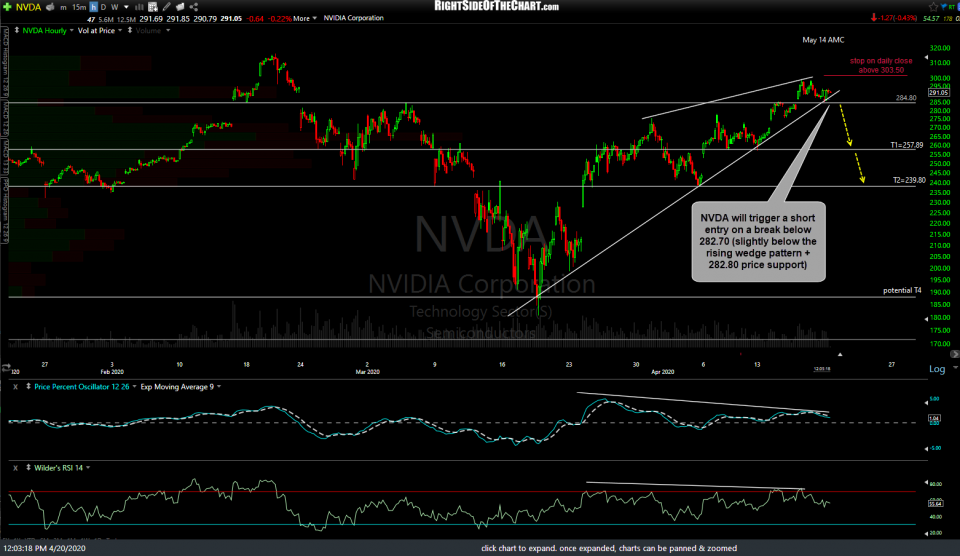
NVDA (NVIDIA Corp.) is on will be added as an official Short Swing Trade Setup, with a short entry to be triggered on a break below 282.70, which is slightly below the rising wedge pattern + 284.80 price support on this 60-minute chart.
The current price targets for this trade are T1 at 257.89 & T2 at 239.80 with the potential for additional targets to be added, depending on how the charts of NVDA, the semiconductor sector, and/or the broad market develop going forward. The suggested stop is a daily close above 303.50 and the suggested beta-adjusted position size for this trade is 0.85.
Zooming out to the daily time frame, NVDA has rallied into the uptrend line off the Aug 2019 lows which it broke down below back in early March & is currently testing it from below following a very brief & minor momentum-fueled overshoot late last week. While the suggested stop is set just below the mid-February all-time high which came at the end of a buying climax, should NVDA manage to take out that previous high anytime soon it will do so with negative divergences in place on the daily time frame as the PPO & RSI are significantly lagging behind the stock price on this rally.
Zooming out even further to the weekly time frame, NVIDIA recent put in a very large divergent high with negative divergences that have been building over the last several years, indicating that a major trend change (i.e.- bear market) in the stock is likely over the next year or more. In fact, the multiyear divergences are really no different than those preceding the divergent highs back in early 2002 & late 2007, both of which were followed by “mean reversion” drops of 90% & 86%, respectively, back down to the primary bull market trendline generated off the 1999 lows from when NVDA first started trading as a publically traded company.
Based on my rough guesstimate of when NVDA is likely to retest that multi-decade trendline next of about 1 -year (those previous two trendline mean reversion corrections from the divergent highs to the TL test took 9-months & 1-year, respectively), that would result in a drop of roughly 85% from the recent divergent high, right in line with those previous two mean reversion cyclical bear markets within the larger secular bull market that remains solidly intact for now.
As always, pass on trade ideas that do not mesh with your risk tolerance, the outlook for the security, and/or trading style. Also, keep in mind this is a Trade Setup, not an Active Trade at this time. A trade setup is a potential trade pending an objective entry, which in this case, is a breakdown below both the 60-minute bearish rising wedge pattern as well as price support just below.


