
Following the bearish engulfing candlestick (daily chart) that I highlighted on Thursday plus this 60-minute bearish rising wedge pattern (and divergent high) breakdown, my minimum swing target is this 117-118ish +interesecting uptrend line support zone with additional potential targets (if/when the support zone is clearly taken out) shown by the dotted arrows.
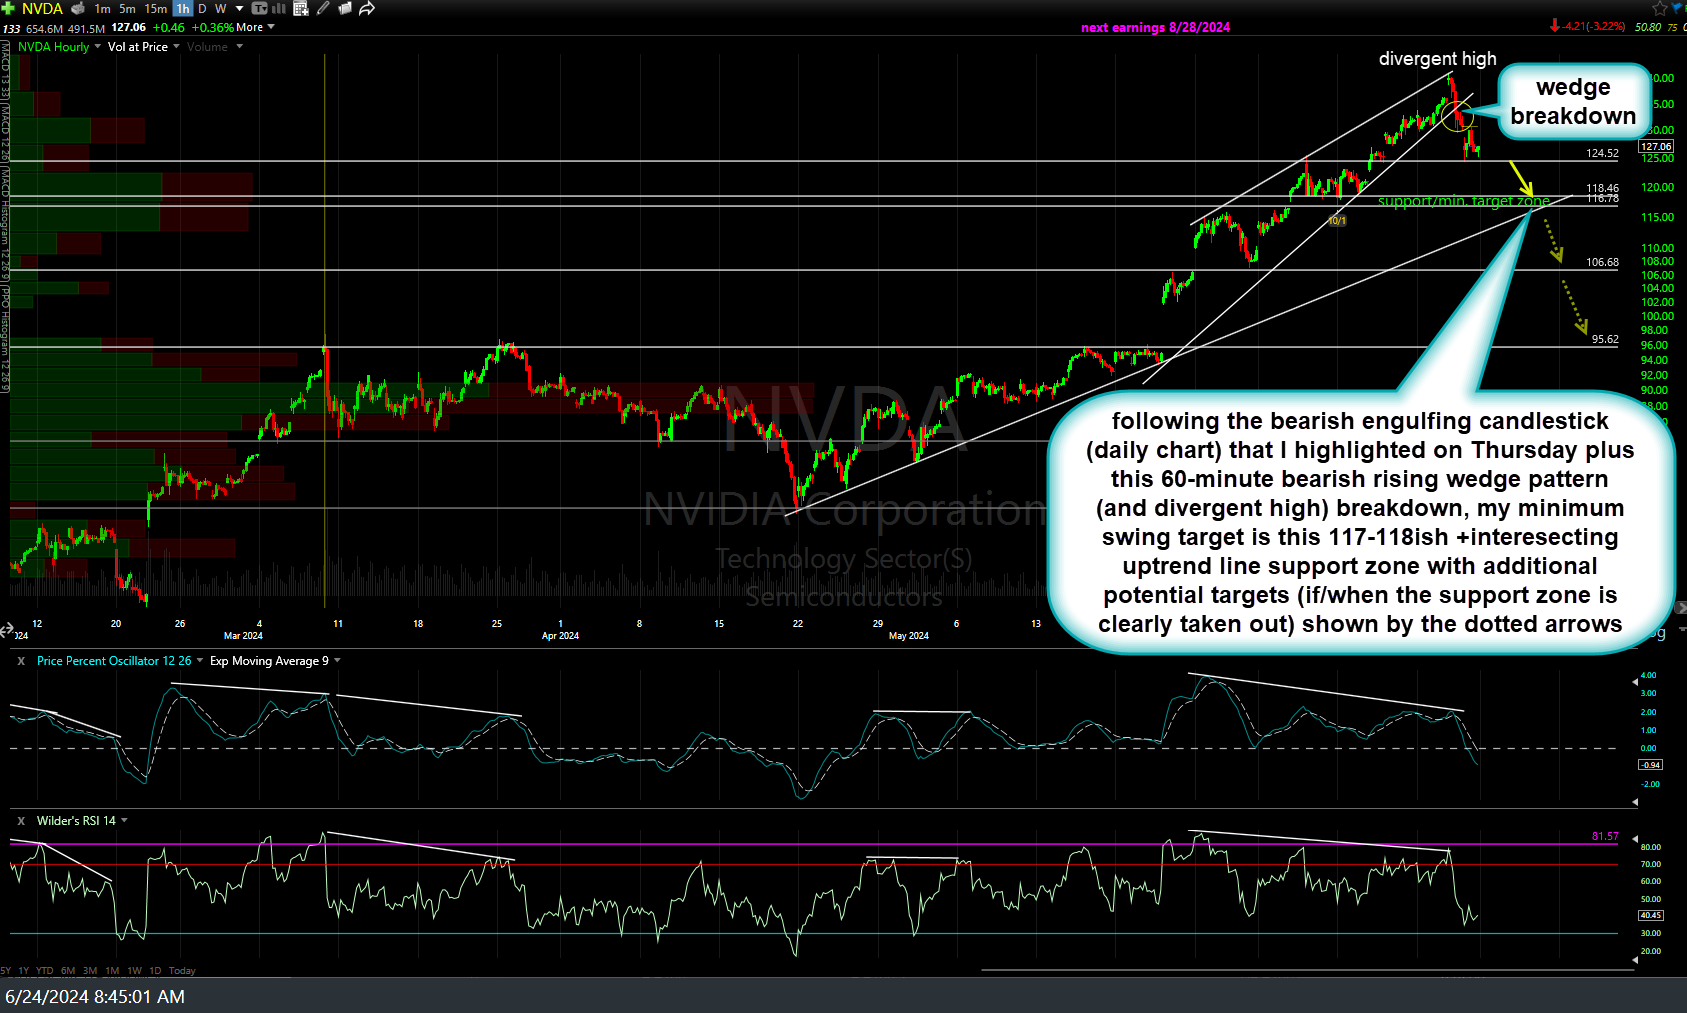
NVDA 60m June 24th
Should Thursday’s bearish engulfing candlestick prove to be a reversal/topping stick (i.e.- marking the end of the uptrend), the daily chart below has some potential longer-term swing/trend targets.
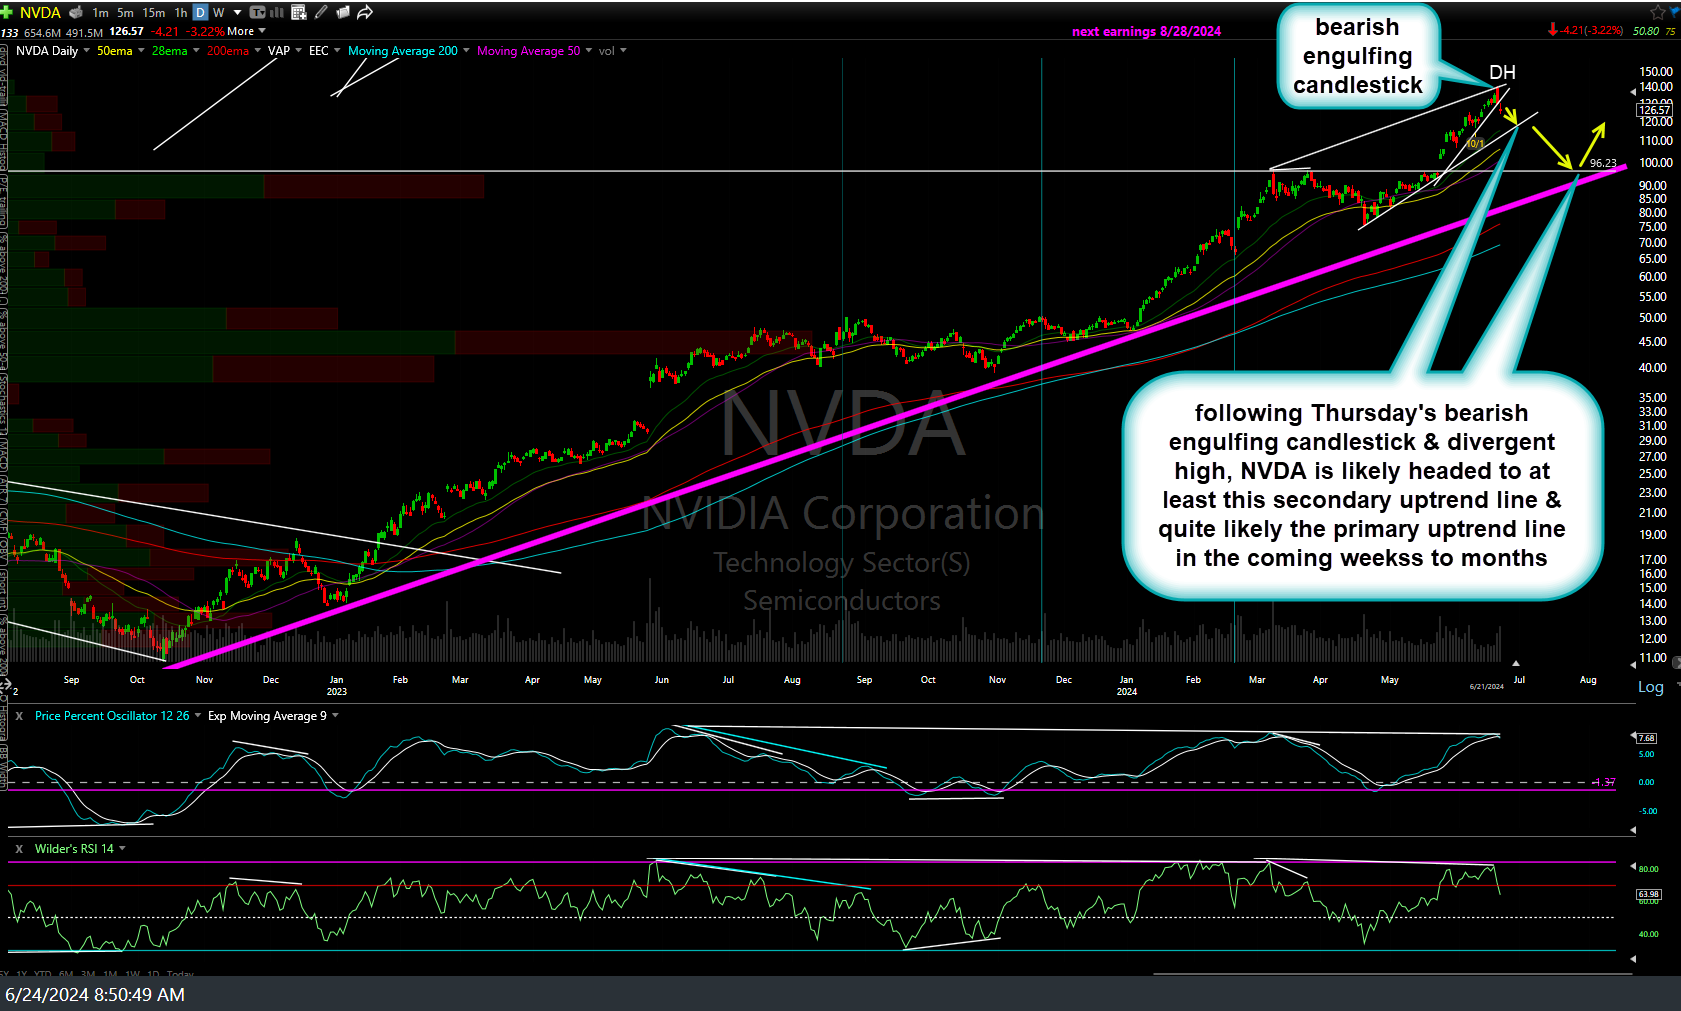
NVDA daily June 24th
Whether you care to trade NVDA or not, if you are trading, or plan to trade, the major stock indices (S&P 500 and/or Nasdaq 100), you would be extremely remiss not to factor in the charts of NVDA into your analysis as it has pretty much become THE stock market, both from a mathematical (largest cap-weighted component) and psychological perspective.