
The next sell signal & objective add-on to yesterday’s short entry at the top of the Deepseek Gap (yesterday’s high) on NVDA (NVIDIA Corp) is still to come on a solid break and/or daily close* below the uptrend line. On the updated daily chart below (second chart), I’ve honed in on more specific price targets with arrow breaks on this daily chart showing the price targets for typical swing traders & my long-term trend targets as previously posted on the weekly charts. Yesterday’s & today’s updated daily, showing NVDA currently testing that key uptrend line support, below. As always, stops should be commensurate with one’s unique entry price(s) and preferred price target(s).
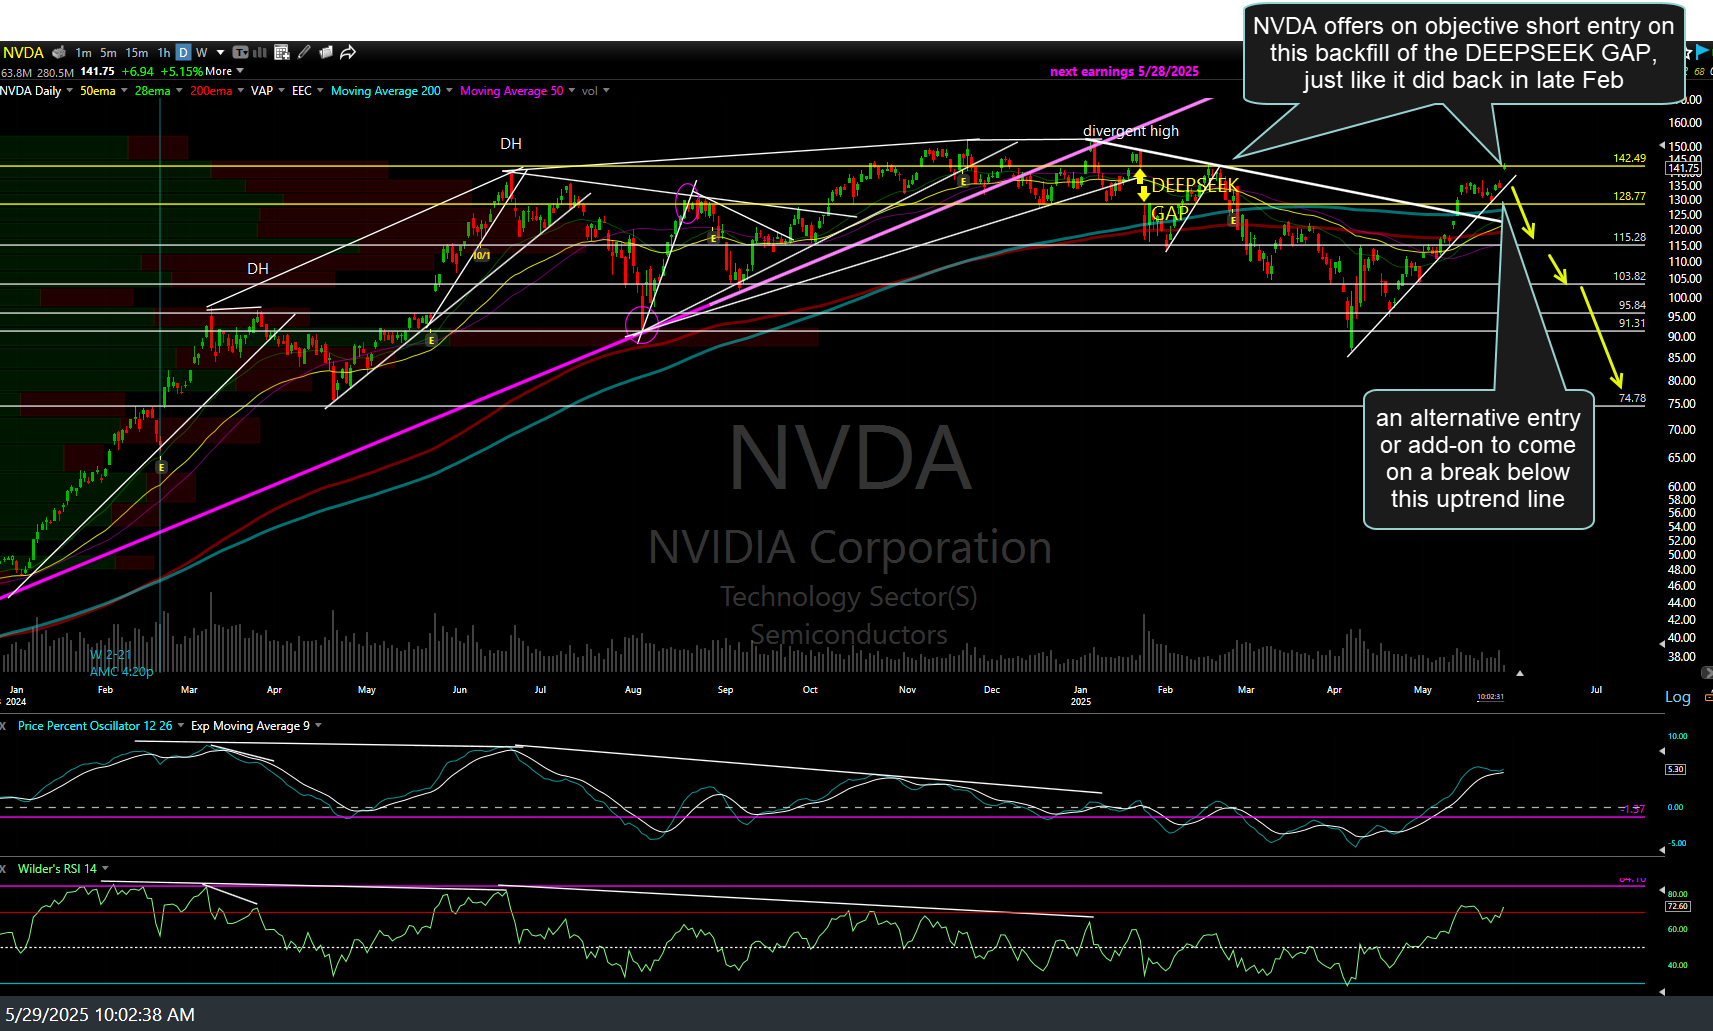
NVDA daily May 29th

NVDA daily May 30th
*Waiting for a daily close below a support level, such as an uptrend line, price support, or bottom of a bearish chart pattern, increases the odds that the breakdown will stick & minimizes the odds of shorting into a whipsaw (false breakdown). A potential downside to waiting for a daily close below is that sometimes prices will drop quickly following an intraday break below key support, providing a less favorable entry price just before the closing bell.