
I really don’t know whether to categorize this post as a new swing trade idea or an update to an existing trade idea although that depends on one’s own preference on how to trade NVDA. Back on June 26th, along with my predictions for where the primary bullish trend off the Oct 2022 lows would terminate, including my longer-term swing/trend targets for SPY & QQQ based on the weekly charts, I also included the following weekly chart with long-term price targets.

NVDA weekly June 26th
On August 5th, right when the stock market (futures & ETFs in pre-market) were bottoming before the stock market opened, along with many of my price targets being high (including NVDA), I made sure to fire off an early post covering all shorts (including NVDA, which had just hit T1 on the weekly & T3 (my final near-term swing target on the 60-minute chart), including the weekly chart below as NVDA had just hit that first long-term swing target where a tradable bounce was likely.
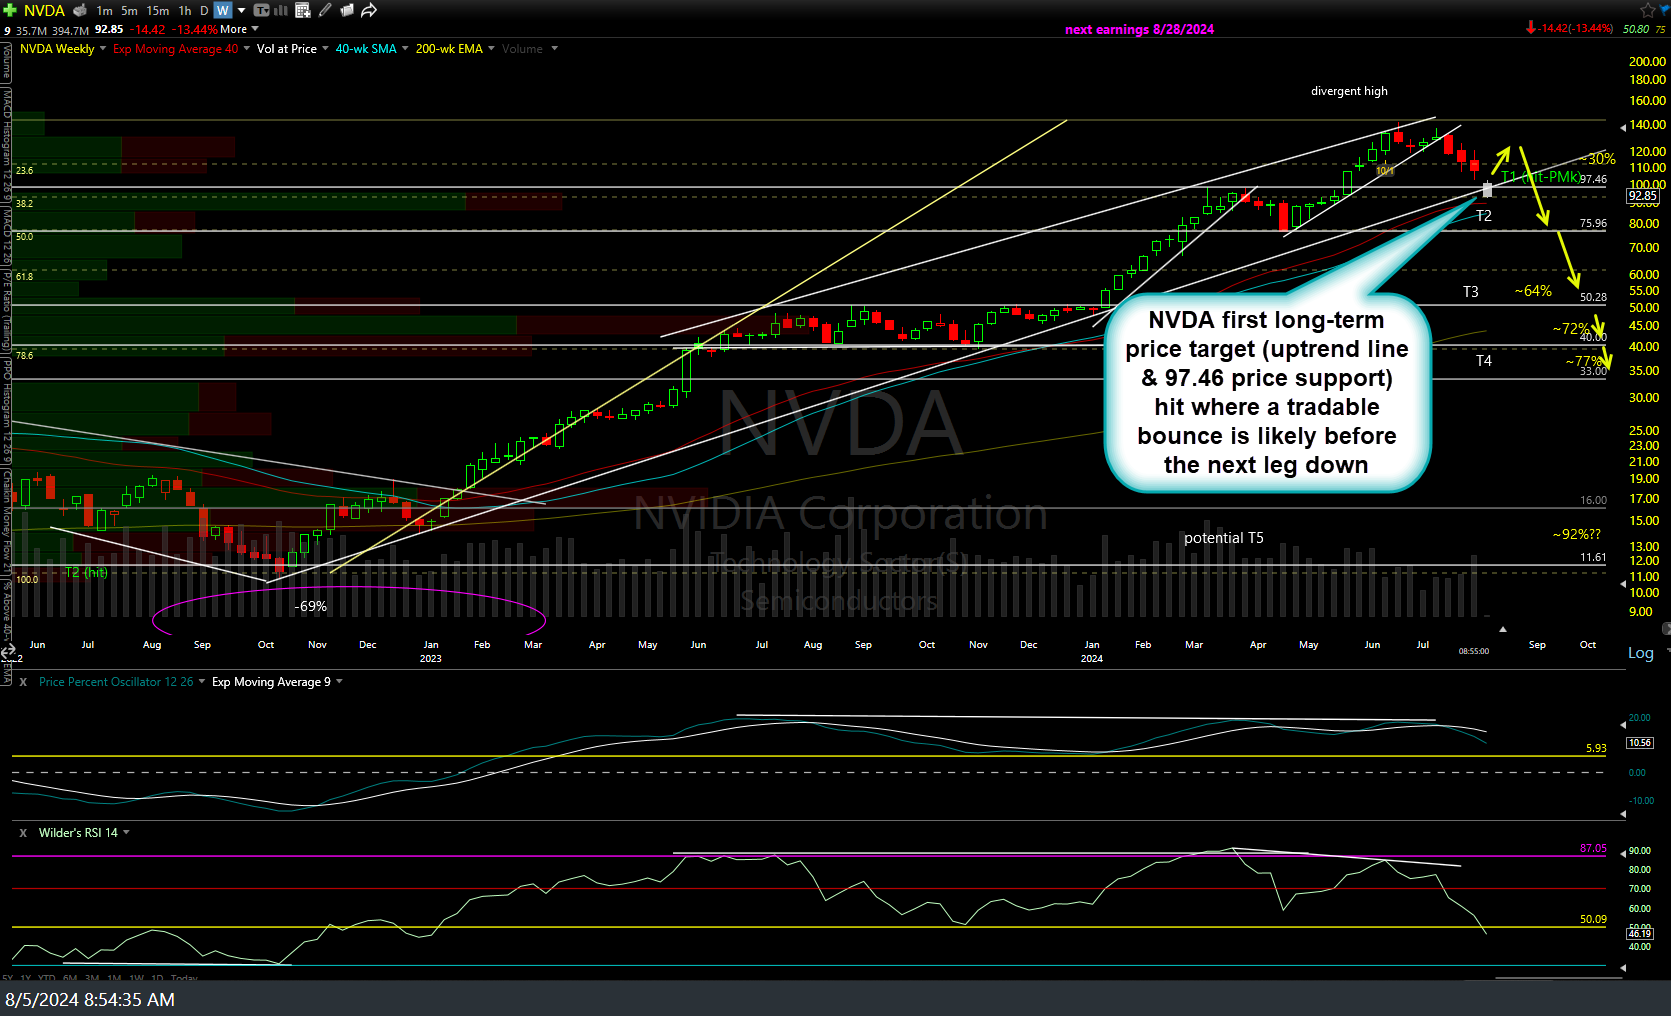
NVDA weekly Aug 5th
While there are too many updates highlighting objective entries & exits, including short-term swing trades, long & short, within that larger swing/trend short off the June 20th top/bearish engulfing candlestick in both videos & static charts on the 60-minute time frame since then, here’s an updated 60-minute chart showing some of the objective short & long entries that were highlighted for swing traders as well as my new “shorting zone” where I plan start adding back a longer-term swing/trend short position for what I suspect will be the next major leg down towards the next long-term targets on that weekly chart.
That scale-in zone starts here at the 118ish resistance, which is the same former support area of my first price target zone from the short off the late June top (support, once broken, becomes resistance) & runs up to the same primary downtrend line off the highs in which I highlighted as providing multiple objective short entries when it was being tested back in mid-August, with NVDA plunging 22% from there (to the long-term uptrend line on the daily chart, in which I once again highlighted that as an objective time to cover the short and/or go long).
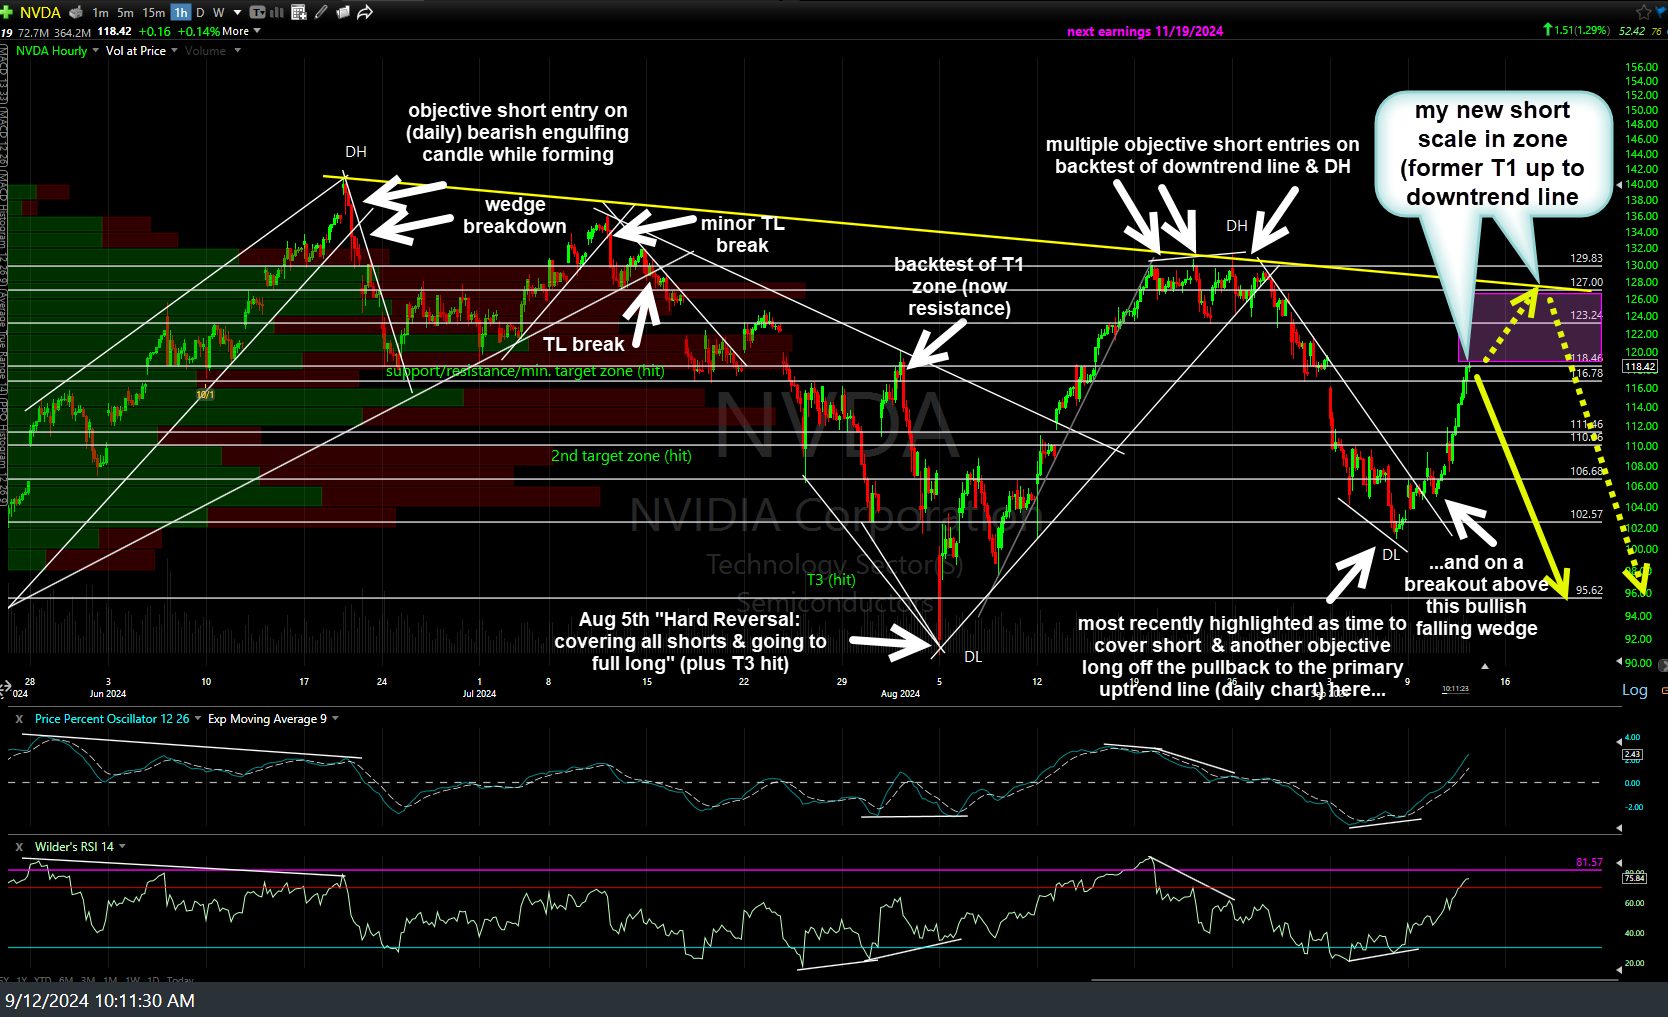
NVDA 60m Sept 12th
As with any trade, this one will either work out or not. As of now, my trading plan is to either hard stop or scale out (layered stops) not far above that downtrend line off the highs, although I will assess the charts of both NVDA & everything else (SOXX, QQQ, SPY, etc.. ) at the time.