A couple of quick comments regarding the markets and trading in general at this time. Keep in mind that the Fed meeting announcement is scheduled for 2:00 pm ET today and Fed announcement days are almost always followed by sharp movements in the broad markets in either direction, often again followed by sharp reversal in the direction opposite the initial reaction. In other words, Fed days are about the worst days to enter new breakouts or stop out of existing trades as large intraday whipsaws are more the rule than the exception.
Another point that I wanted to mention, and although I often state this on the site it still bears repeating: I strive to continue post what I believe to be the most attractive setups, both long and short, regardless of my current market bias or positioning. There are times, however, like now, where the risk/reward on both long and short trades may not be very favorable and as such, keeping position sizes light and/or being very selective on establishing new positions might be the best strategy (or even going completely flat/to cash). I have been pouring through the charts lately and right now I’m just not very comfortable with what I see. On one hand, we still have numerous red flags as the market flirts with new highs and the odds for at least a half-decent correction are quite elevated at this point. On the other hand, this market has had a persistent bid beneath it lately in addition to the short & intermediate-term trend indicators recently flipping back to bullish after some relatively brief sell signals that proved (so far) to be whipsaws. With most trend indicators bullish at this time I have been looking to add some additional long trade ideas but am have a difficult time finding objective long entries. With the broad markets at or near new all-time or multi-year highs, bottoming patterns are few and far between right now. There are are few continuation patterns and stocks poised to break out to new highs that I’m seeing but very few that stand out as clearly bullish. With the Fed on deck today, my intention is to let the dust settle this week and possibly add some of the long setups on my watch list over the weekend.
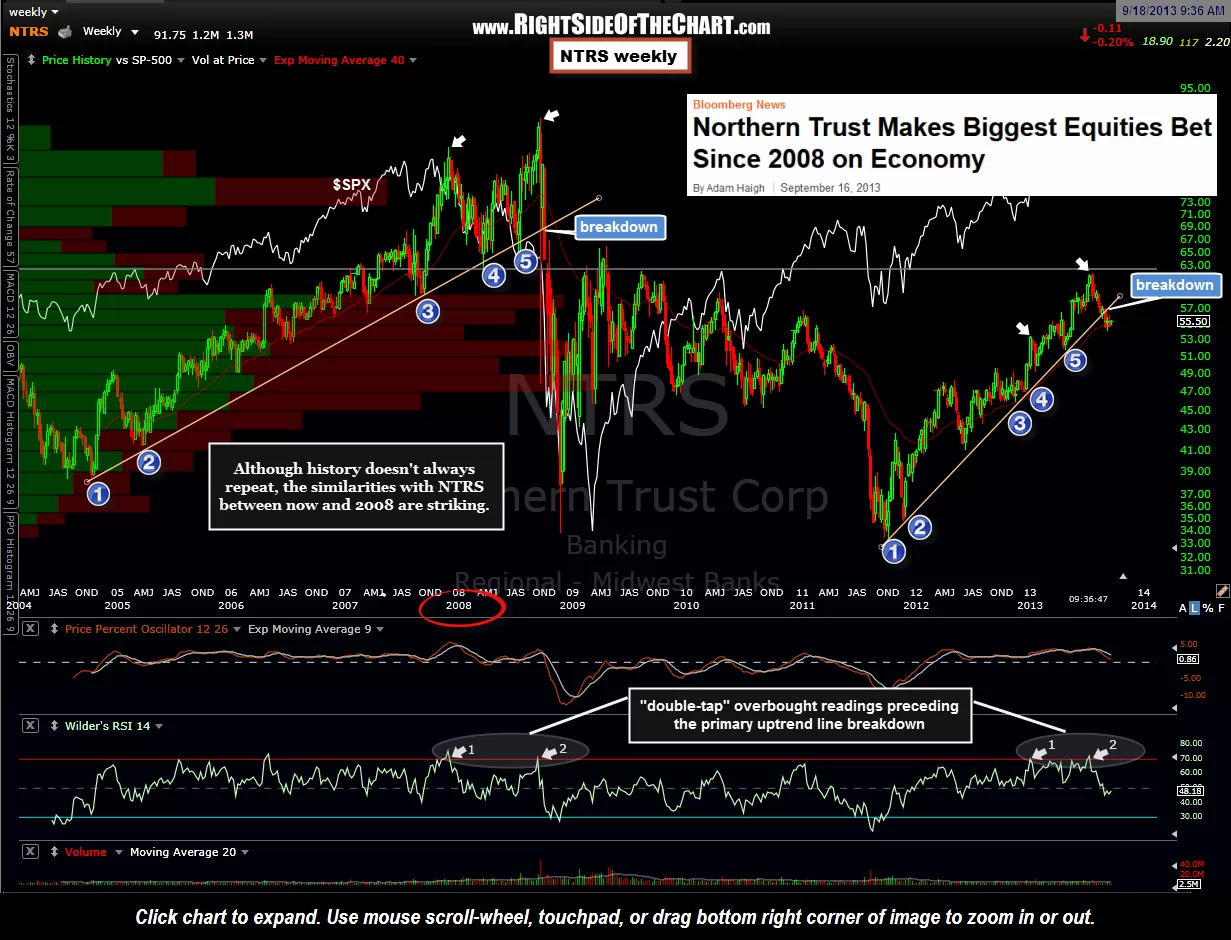
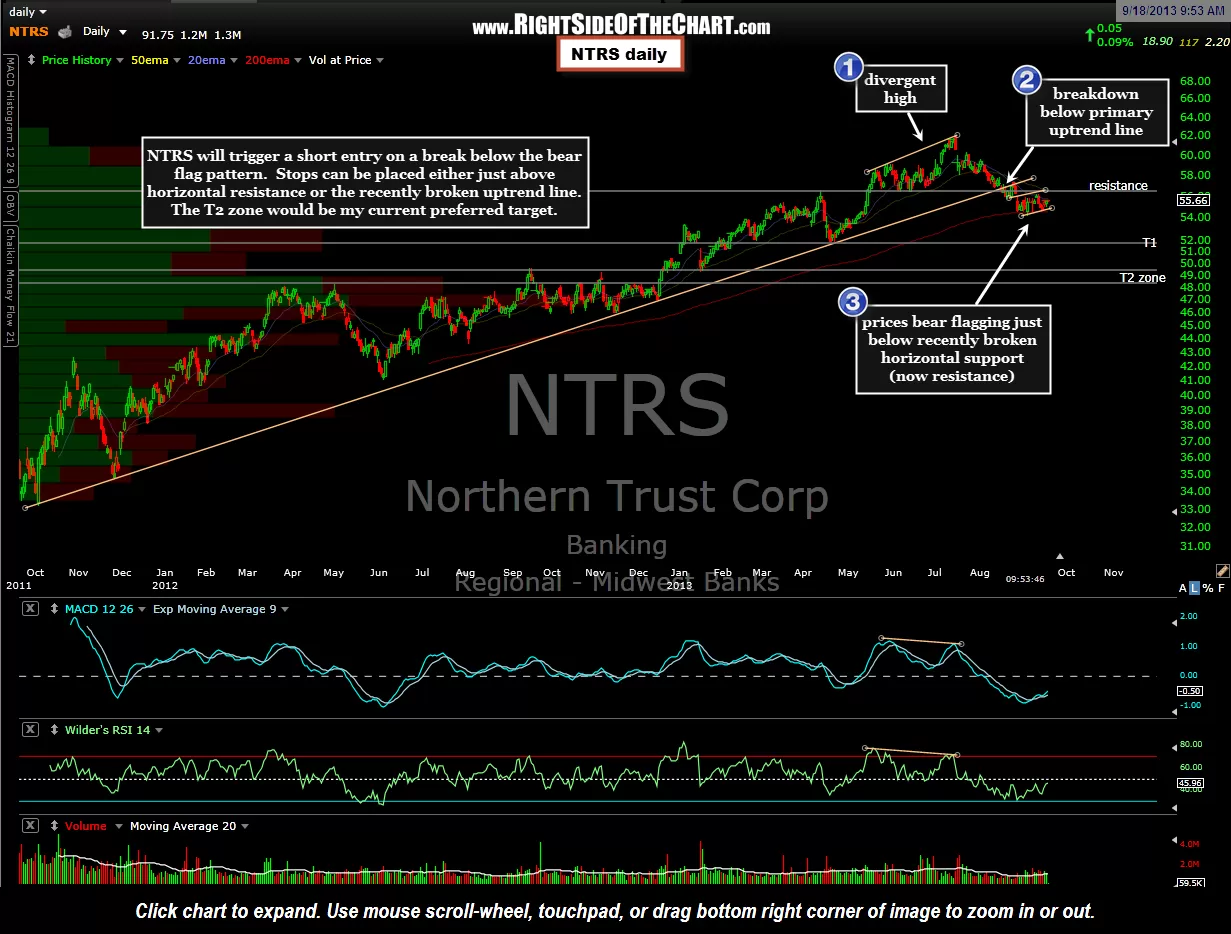
Until then, I’ll continue to post what I believe are the most attractive chart patterns, even if those are counter-trend trades, such as this NTRS short setup. I came across this headline yesterday; Northern Trust Makes Biggest Equities Bet Since 2008 on Economy, and couldn’t help but think of the irony of the timing of this bet. Here we are, once again past the average duration of a bull market and NTRS just now decides to go and load the boat on stocks? How’d that work for you last time NTRS? Although the article doesn’t cite the exact date, it says NTRS has increased their equity positioning to the largest over-weighted position in 5 years. 5 years ago today, the $SPX dropped by another ~44% before the bear market ended in 2009. Regardless of their horrendous timing back then, my case for adding NTRS as a short setup here is based solely on the current technical posture and recent price action of the stock. The weekly chart shows some of the uncanny similarities between today and 2008 but the daily chart lists the primary reasoning for adding the stock as a short setup, with an entry to be triggered on a break below the bear flag pattern. Weekly & daily chart: