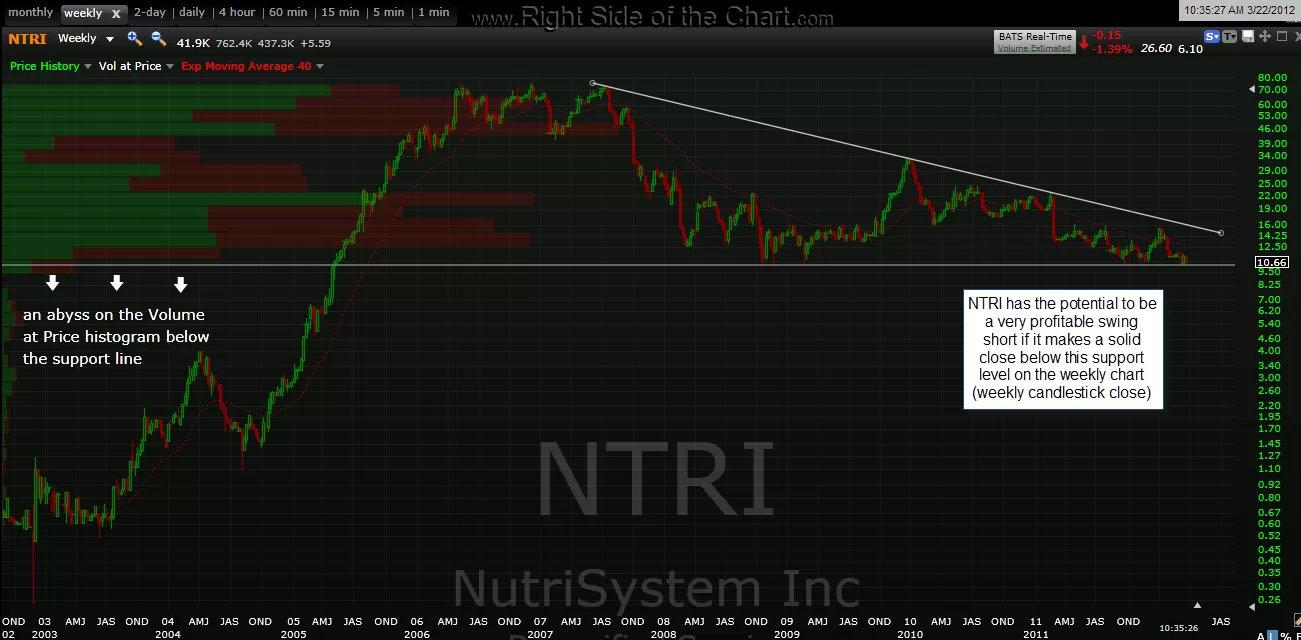
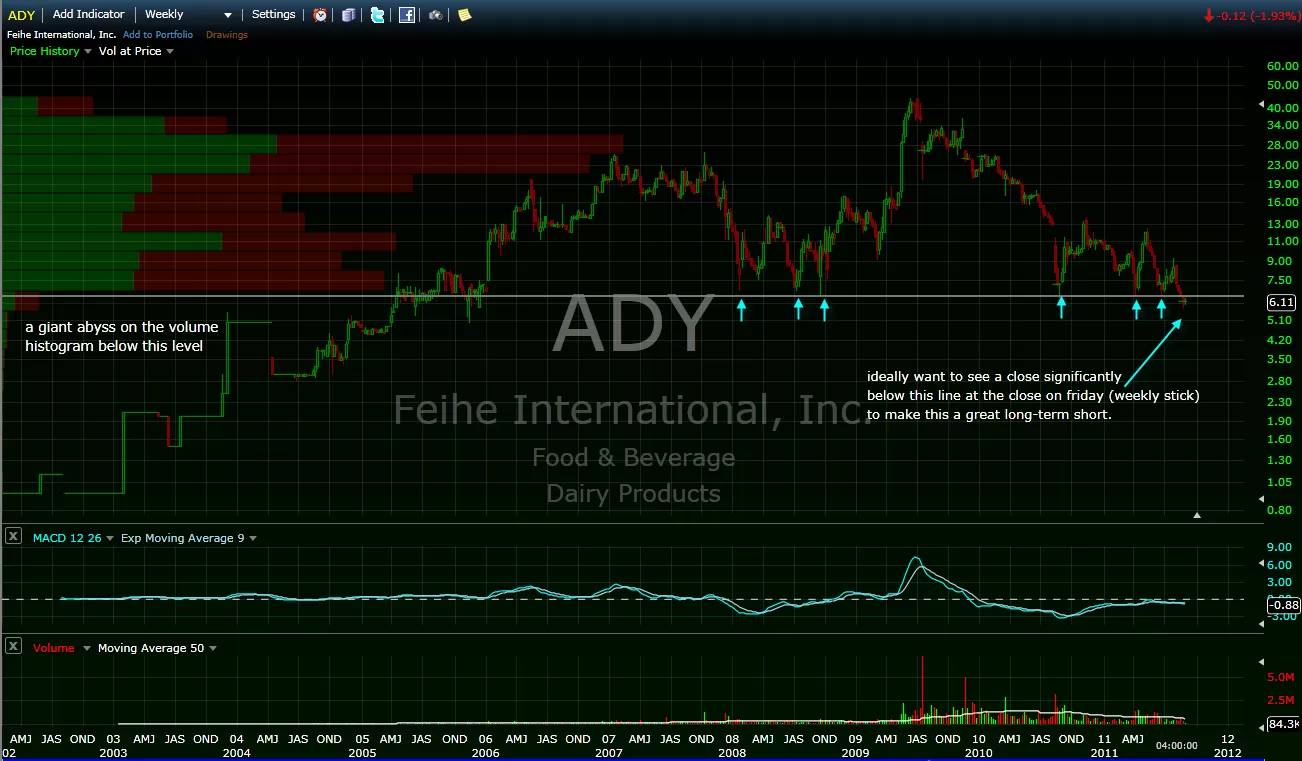
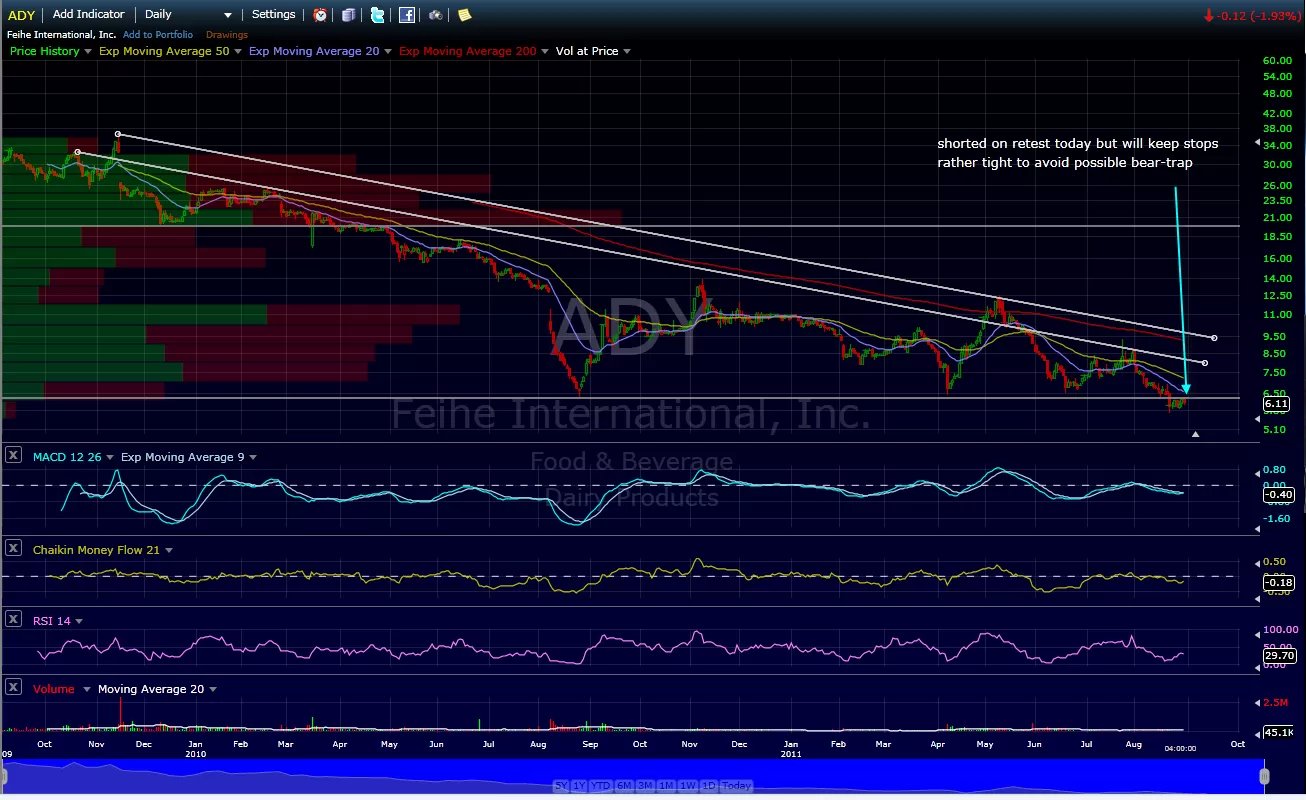
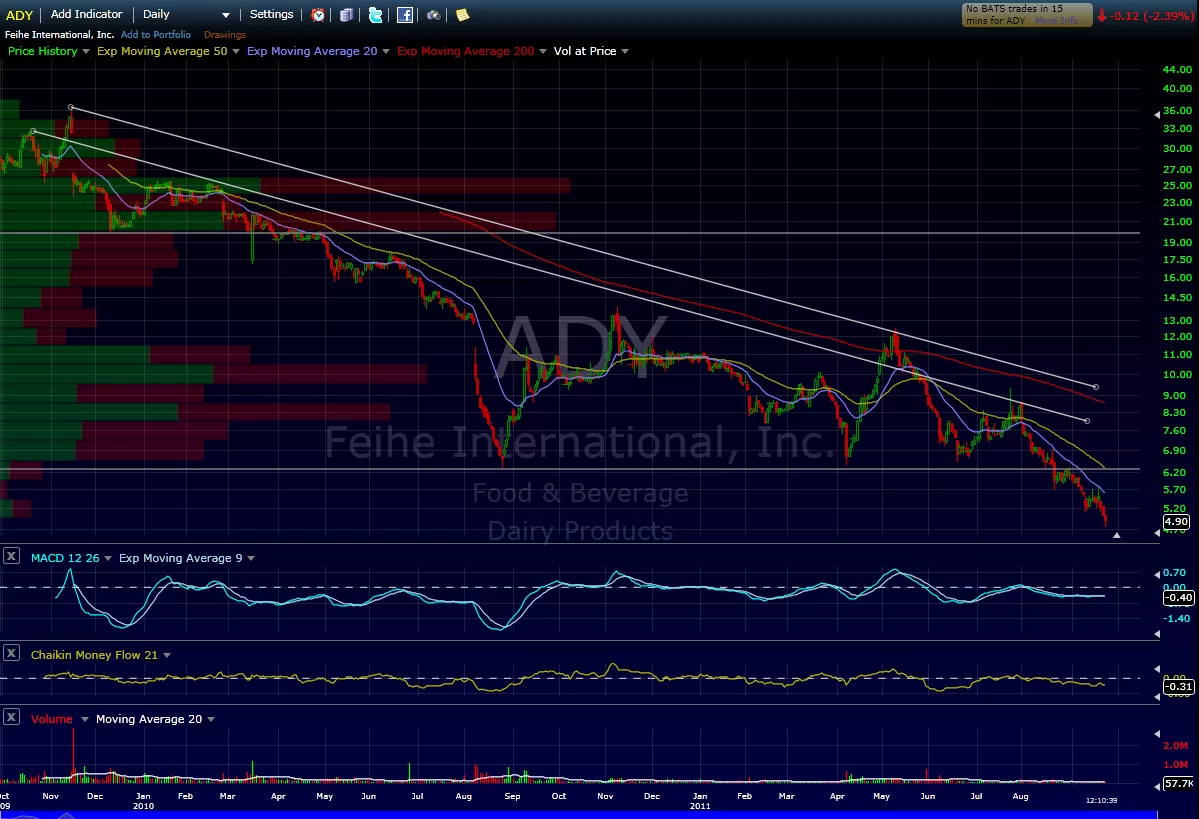
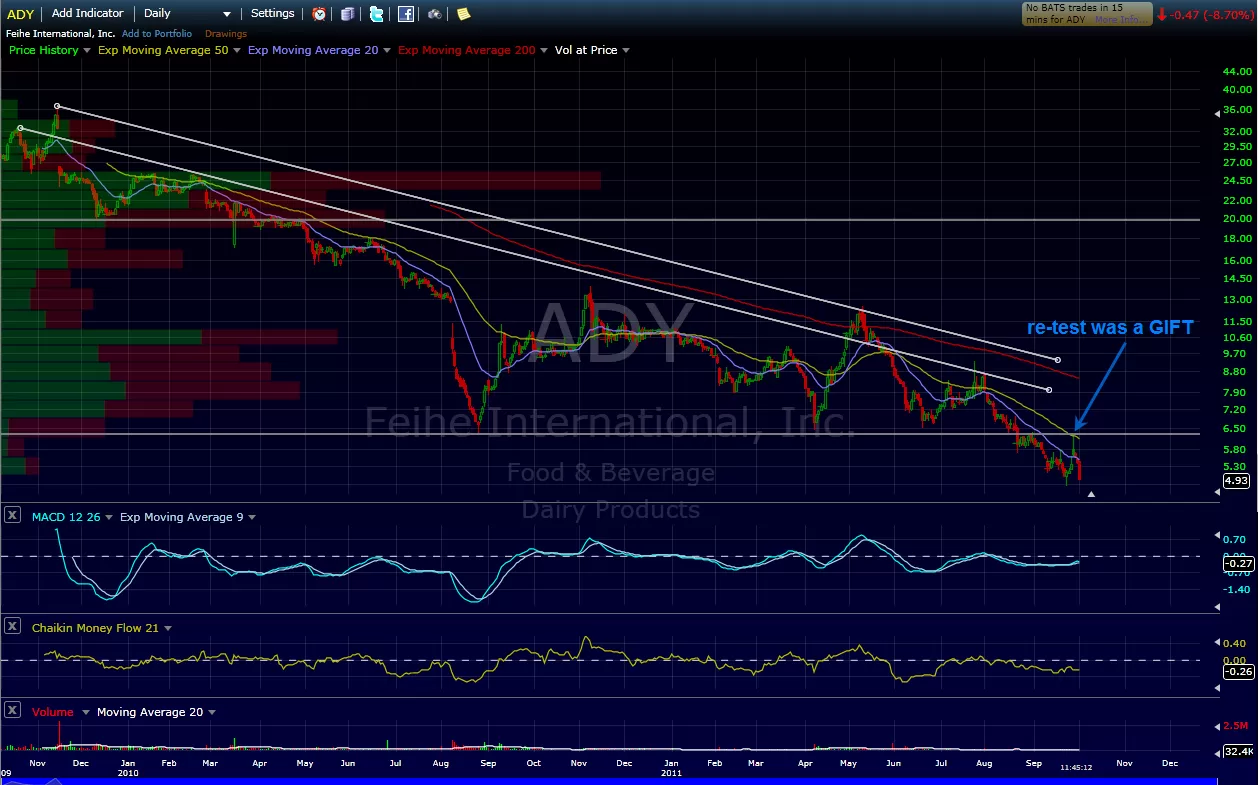
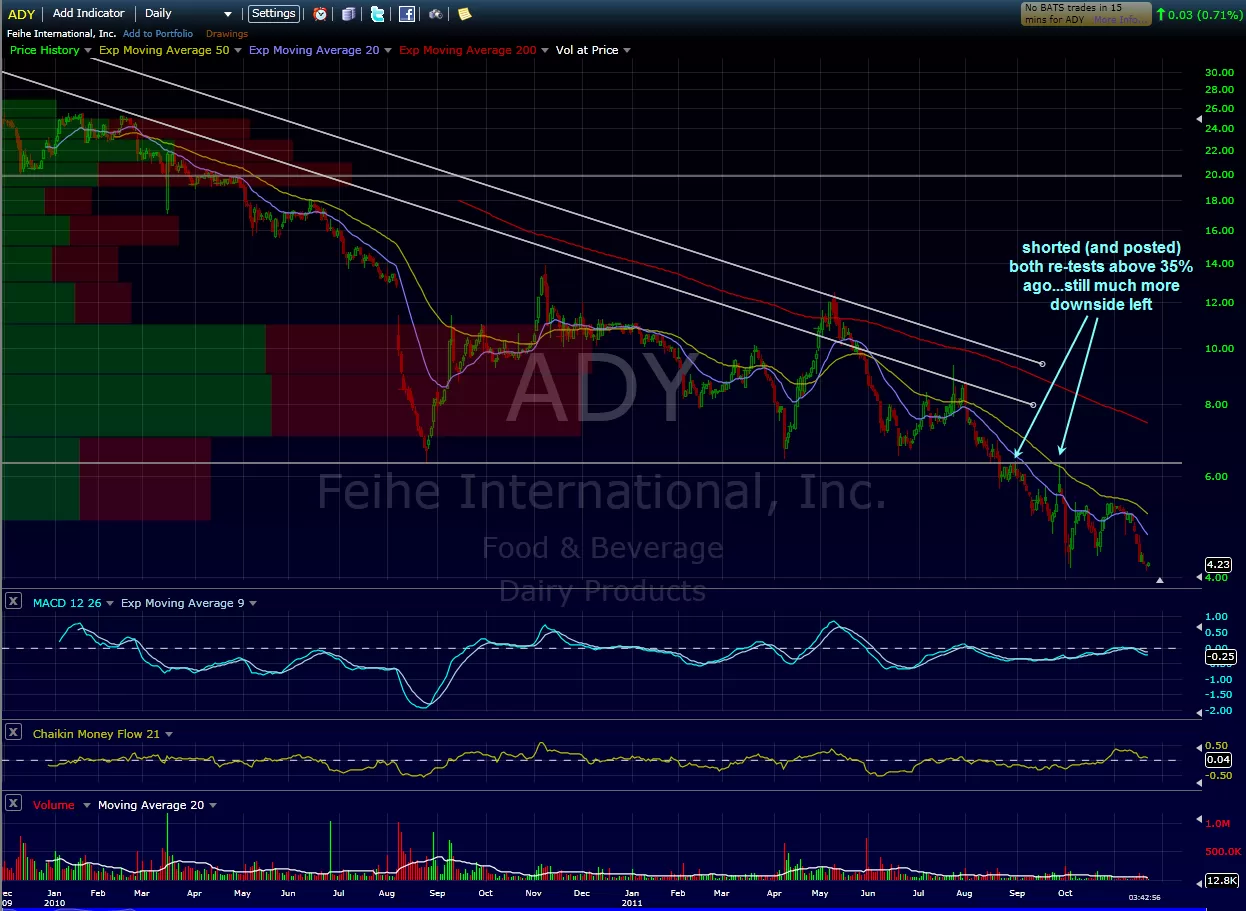
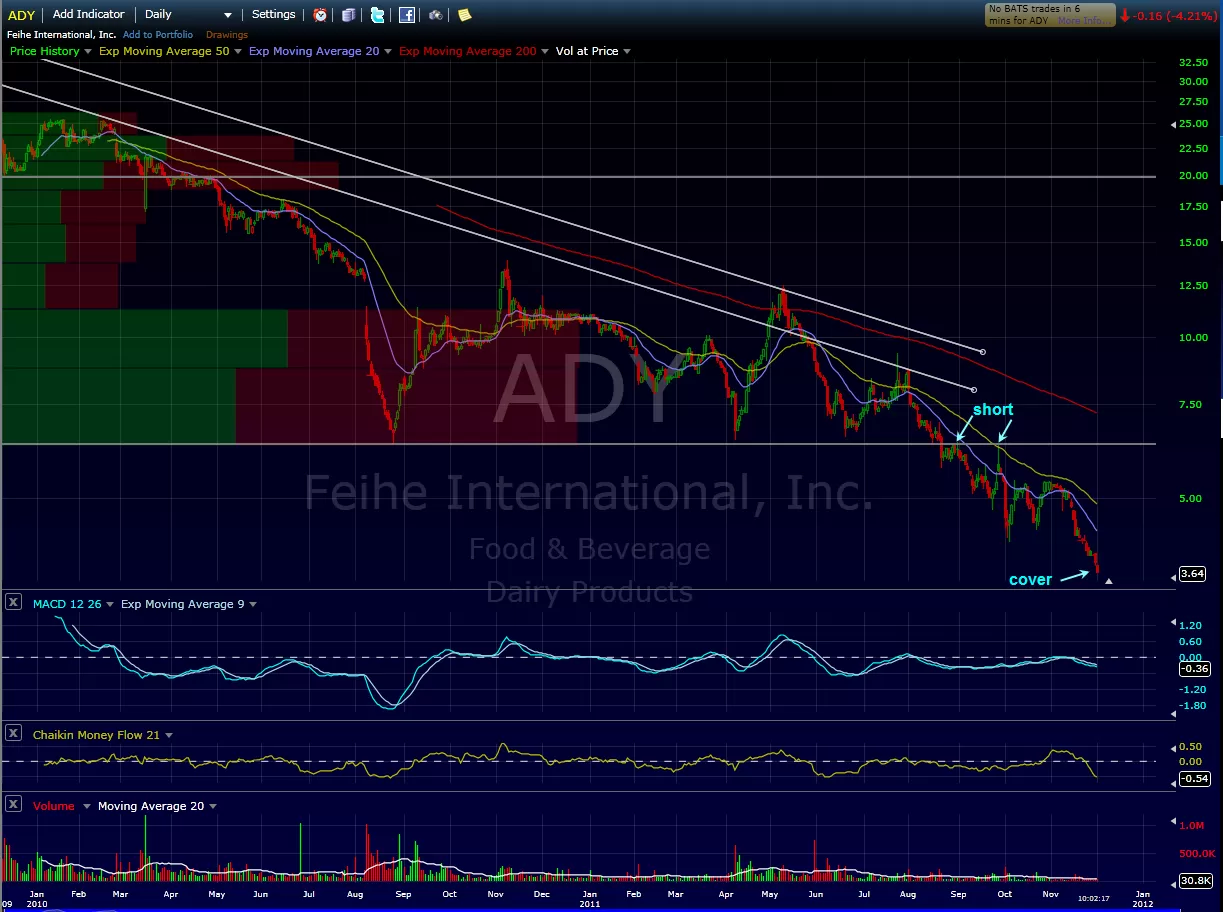
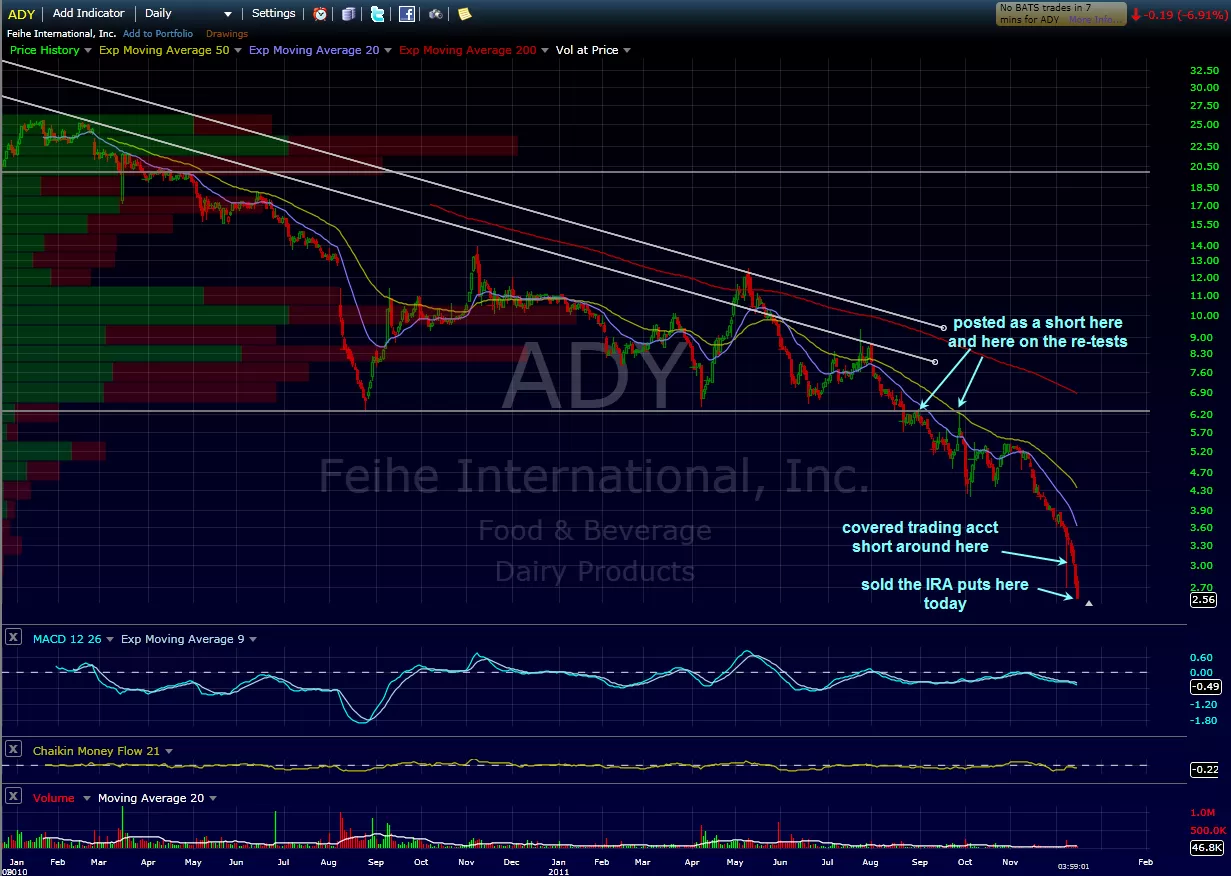
NTRI (NutriSystems) is about to lose some weight of it’s own, in the form of market cap that is, if it makes a confirmed break of this support level. this chart reminds me so much of one of my most profitable swing shorts last year, ADY (which was posted step-by-step with these charts below at breakpointtrades.com). both charts had a massive vacuum of past volume (as evidenced by the vol at price histogram) below an extremely well defined support level.
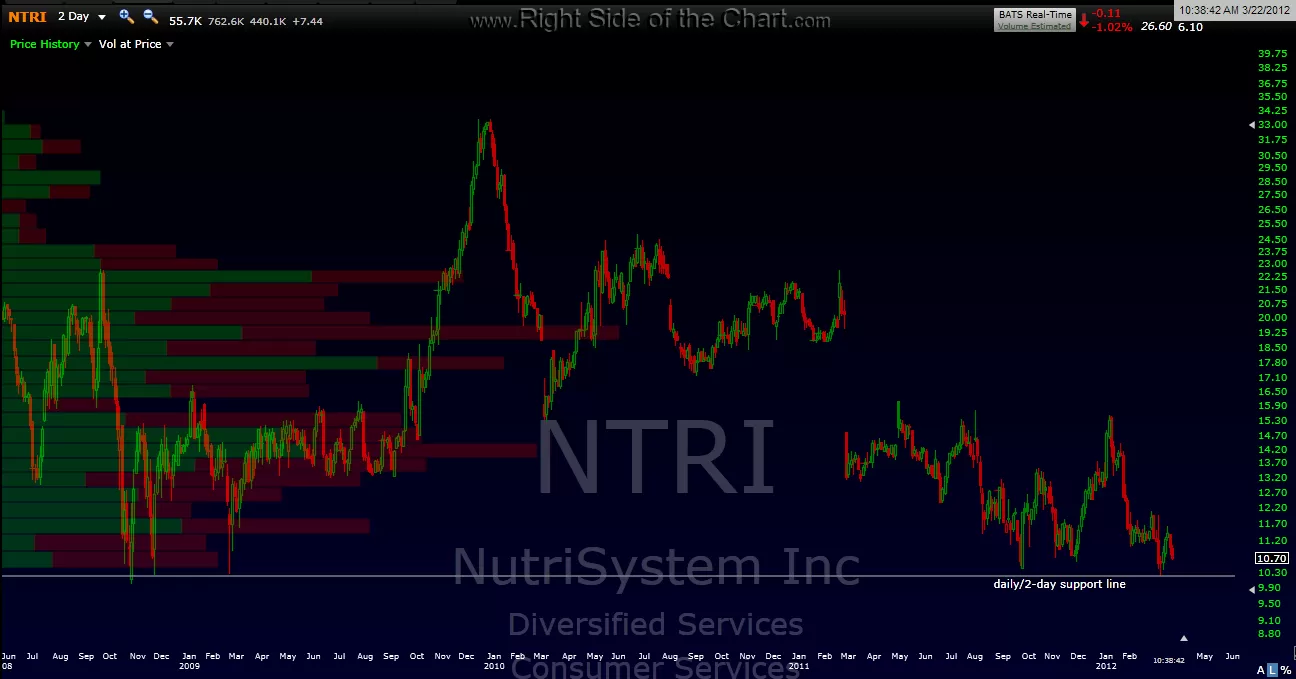
like ADY, my preference is to see a solid close below that level on the weekly time frame (meaning by end of day friday). however, one could also begin scaling in on a break of the support line on this 2-day period chart. NTRI weekly and 2-day charts first, then the ADY weekly, then daily charts for reference on how that trade played out. personally, i’ve started to scale in earlier this week but only with a small starter position so far as support is support until broken.