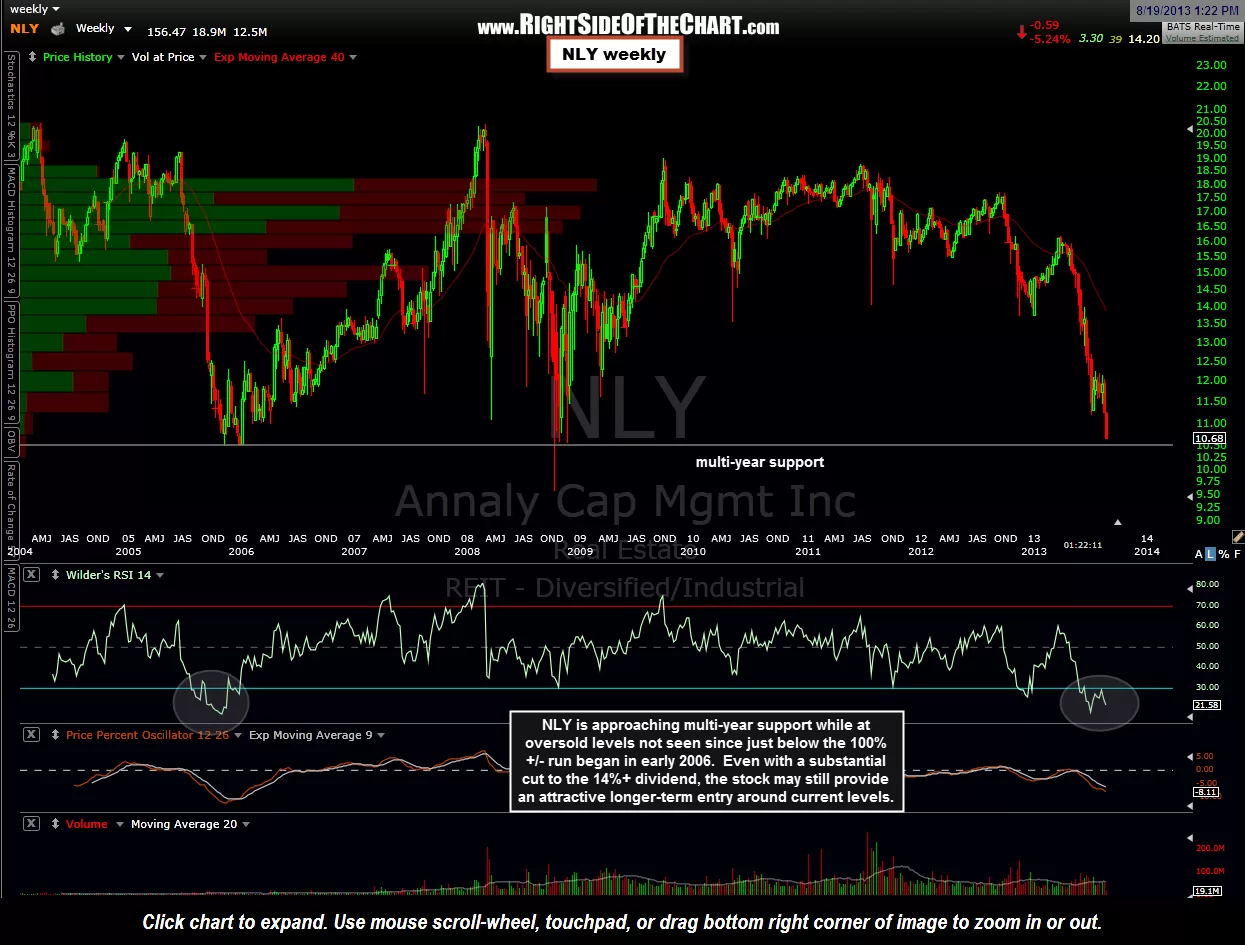
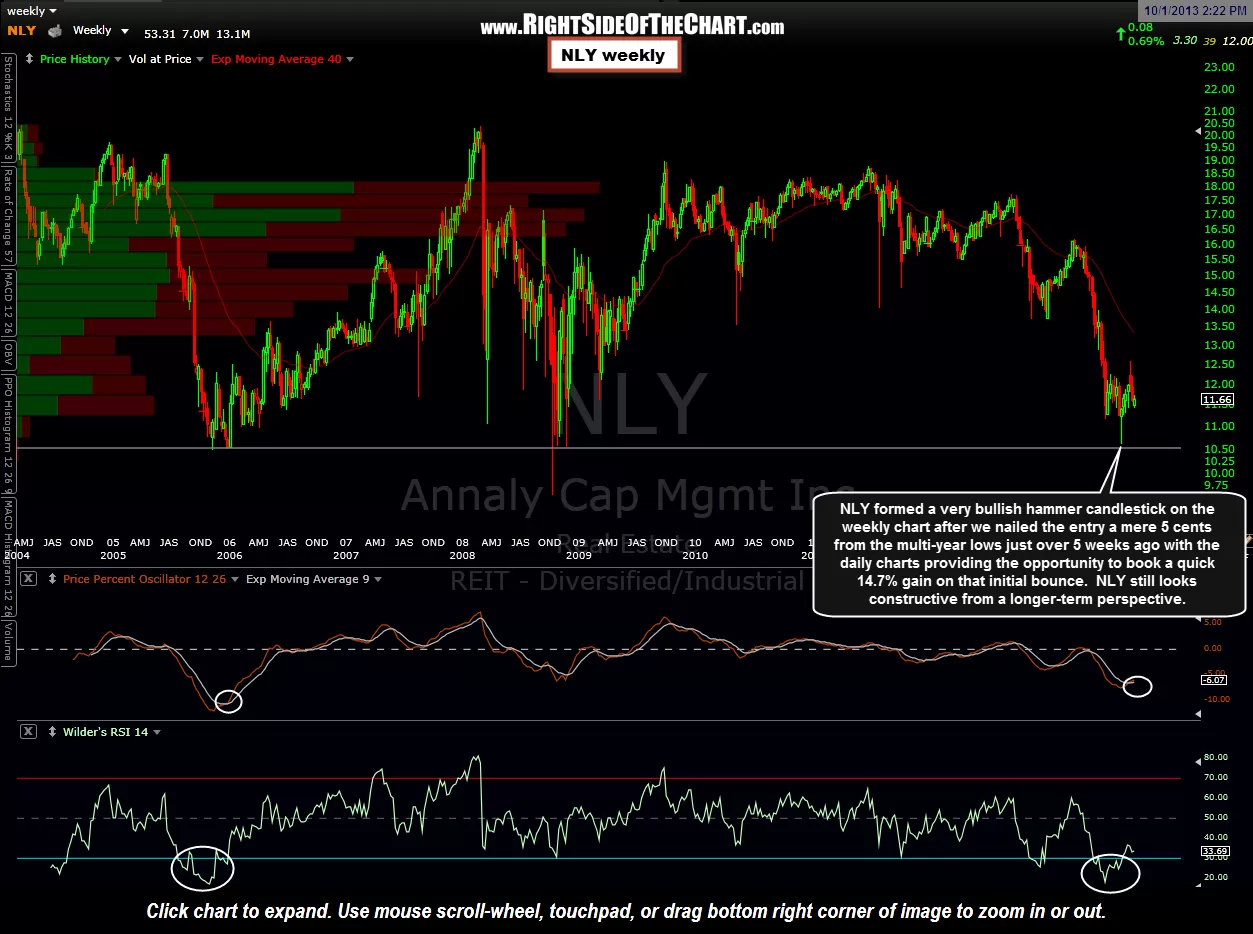
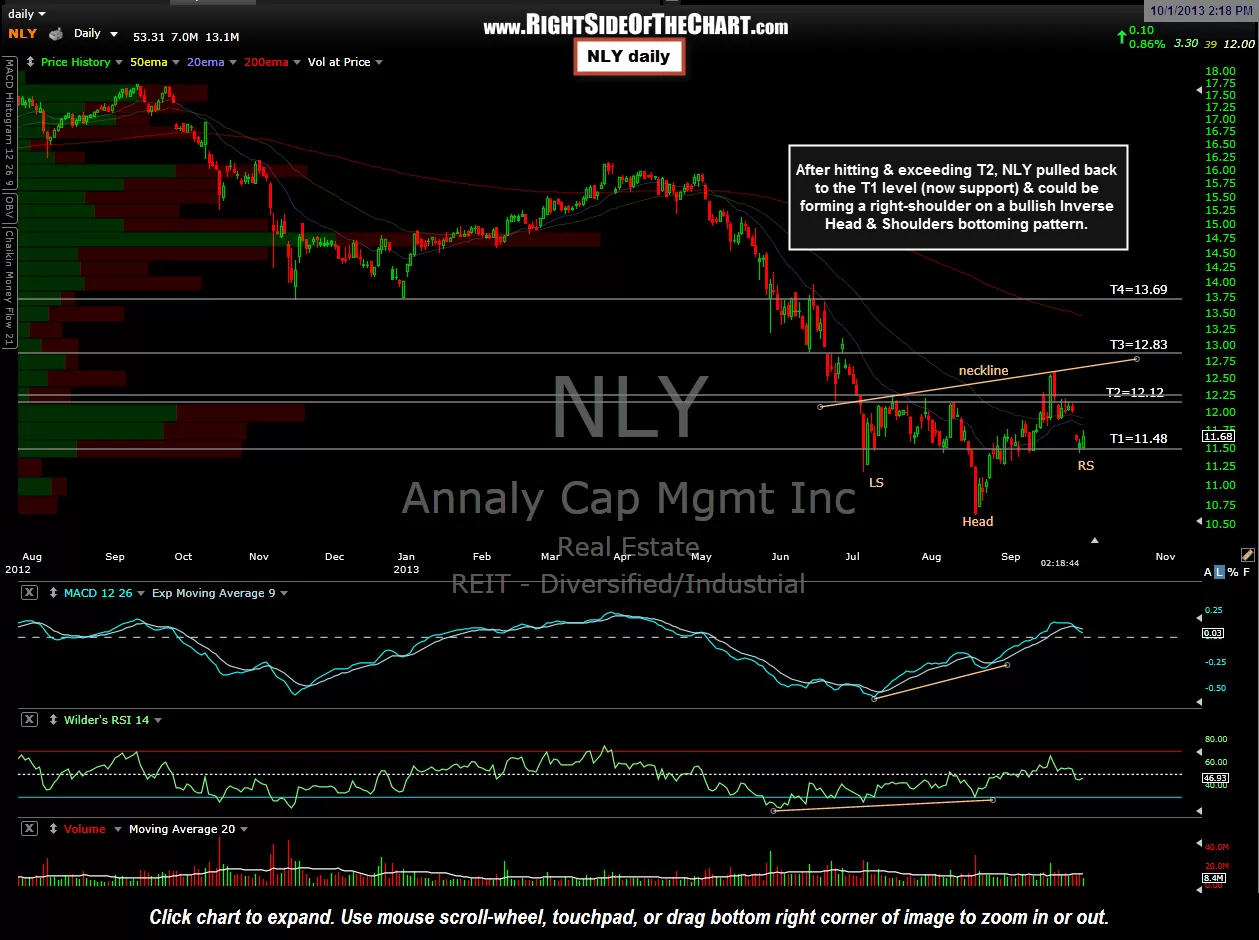
NLY formed a very bullish hammer candlestick on the weekly chart after we nailed the entry a mere 5 cents from the multi-year lows just over 5 weeks ago followed by the opportunity to book a quick 14.7% gain on that initial bounce as per the daily charts. NLY still looks constructive from a longer-term perspective. Zooming down to the daily time frame, after hitting & exceeding T2, NLY pulled back to the T1 level (now support) & could be forming a right-shoulder on a bullish Inverse Head & Shoulders bottoming pattern. As such, I plan to add back the shares that I sold on the pop above T2 with a somewhat liberal stop below. Previous & updated weekly charts followed by the updated daily chart.

Results for {phrase} ({results_count} of {results_count_total})
Displaying {results_count} results of {results_count_total}