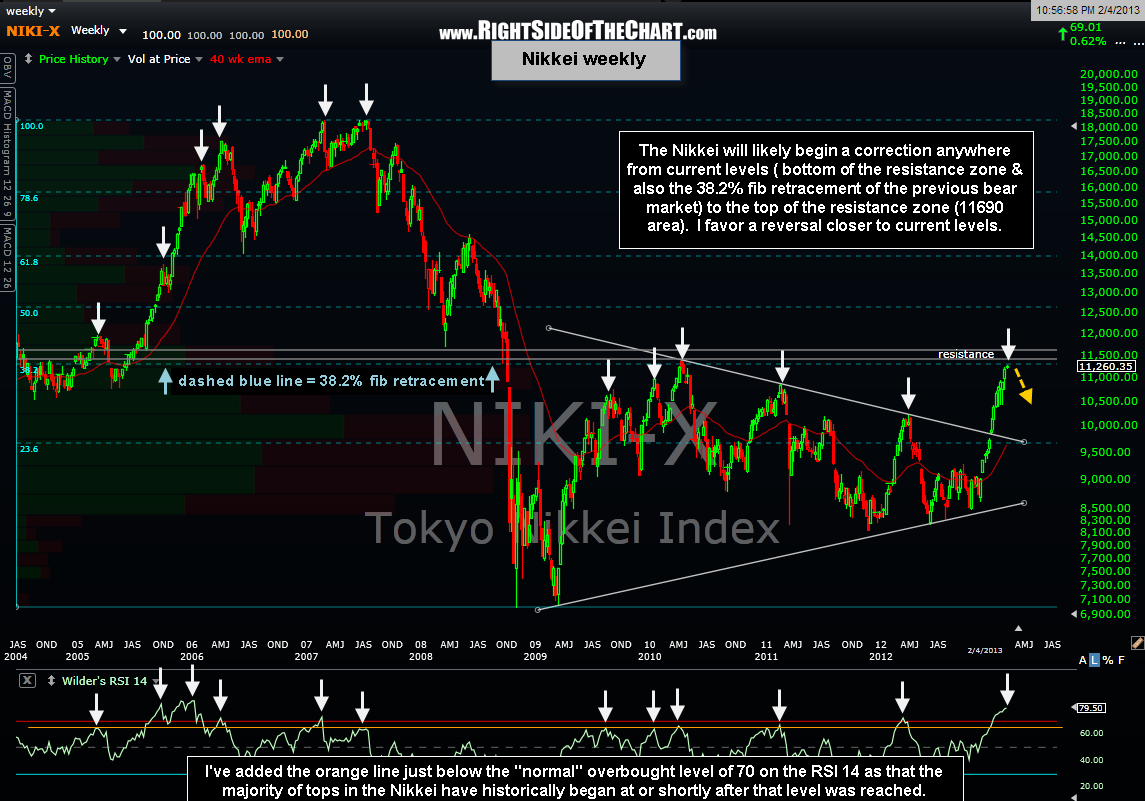
 The Tokyo Nikkei Index is likely on the verge of, at the very least, a decent correction. As this weekly chart (right) illustrates, the Nikkei has made an extremely over-extended run to just shy of both a key horizontal resistance zone (white horizontal lines) as well as the 38.2% fibonacci retracement of it’s previous cyclical bear market (2007- late 2008/early 2009).
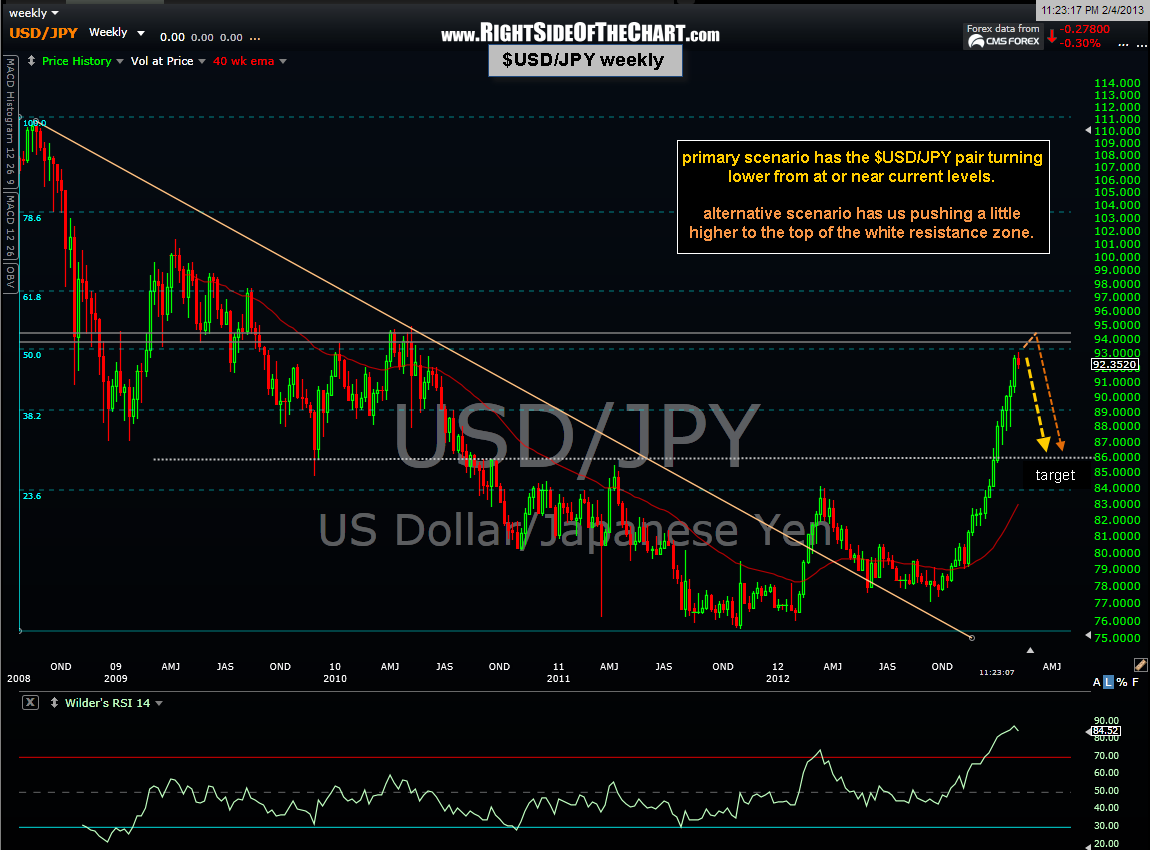
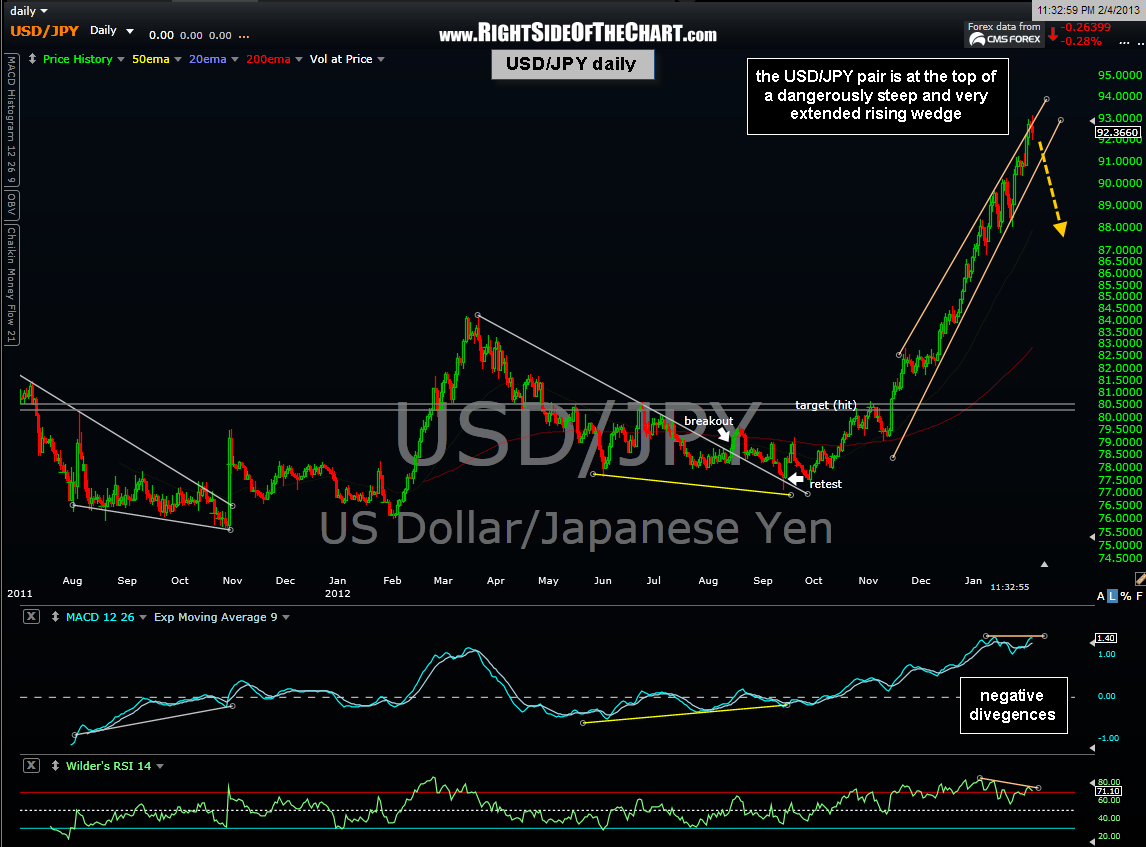
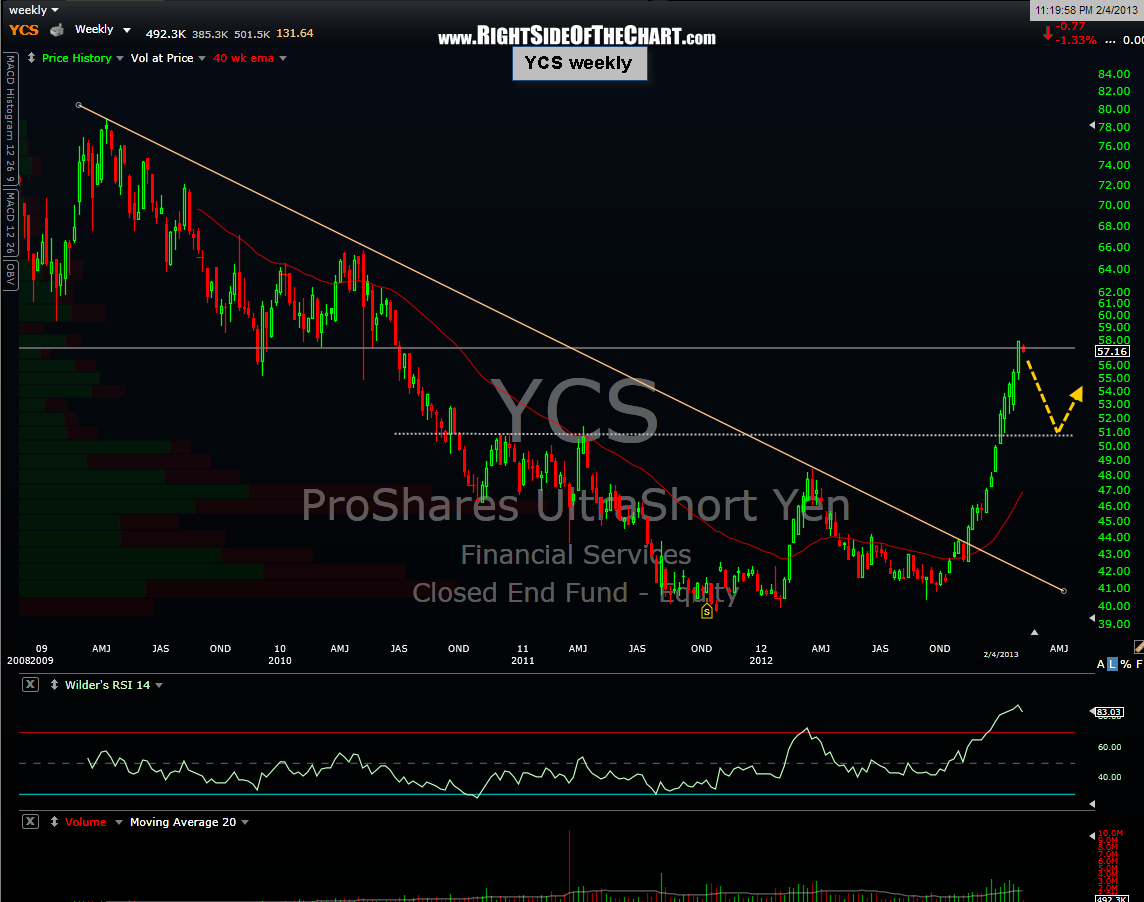
The next three charts below are the daily & weekly views of the $USD/JPY currency pair (which rises when the Yen falls and vice versa) along with YCS, one of several ETF/ETN proxies which can be used to trade the Japanese Yen if one does not have the ability or experience* to trade currency pairs. (*I’m not going to go thru all the boiler-plate disclosures, which can be found here, just know that trading currencies, like any other investment vehicle, entails substantial risk so as always, DYODD).