NIHD was a recent long trade on the site which hit the 2nd target for a 30.4% gain on Sept 20th where I had suggested booking full profits due to the strong likelihood of a pullback and posted doing so personally at that time. The stock did indeed go on to pullback very sharply from that point but I’ve kept it on my radar and once again the stock is setting up for another possible objective long entry.
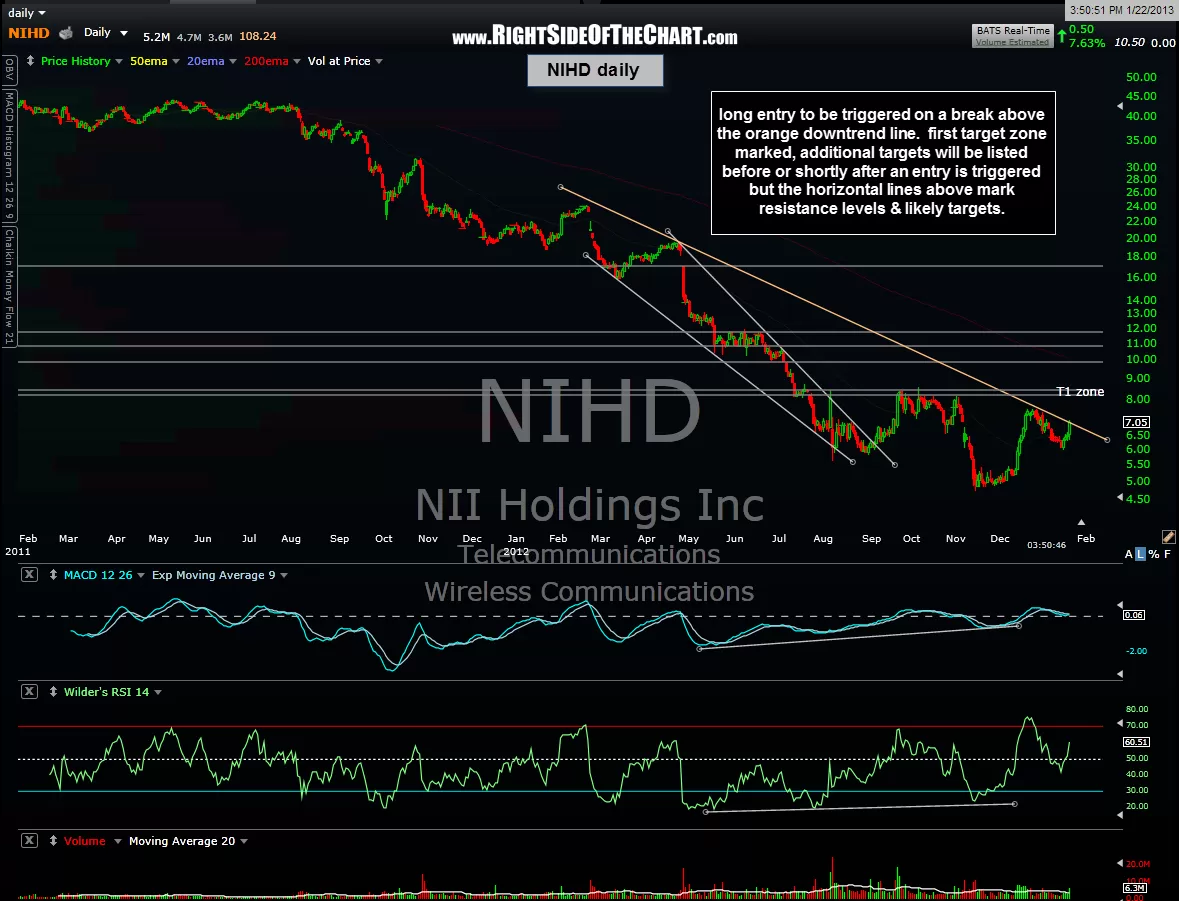
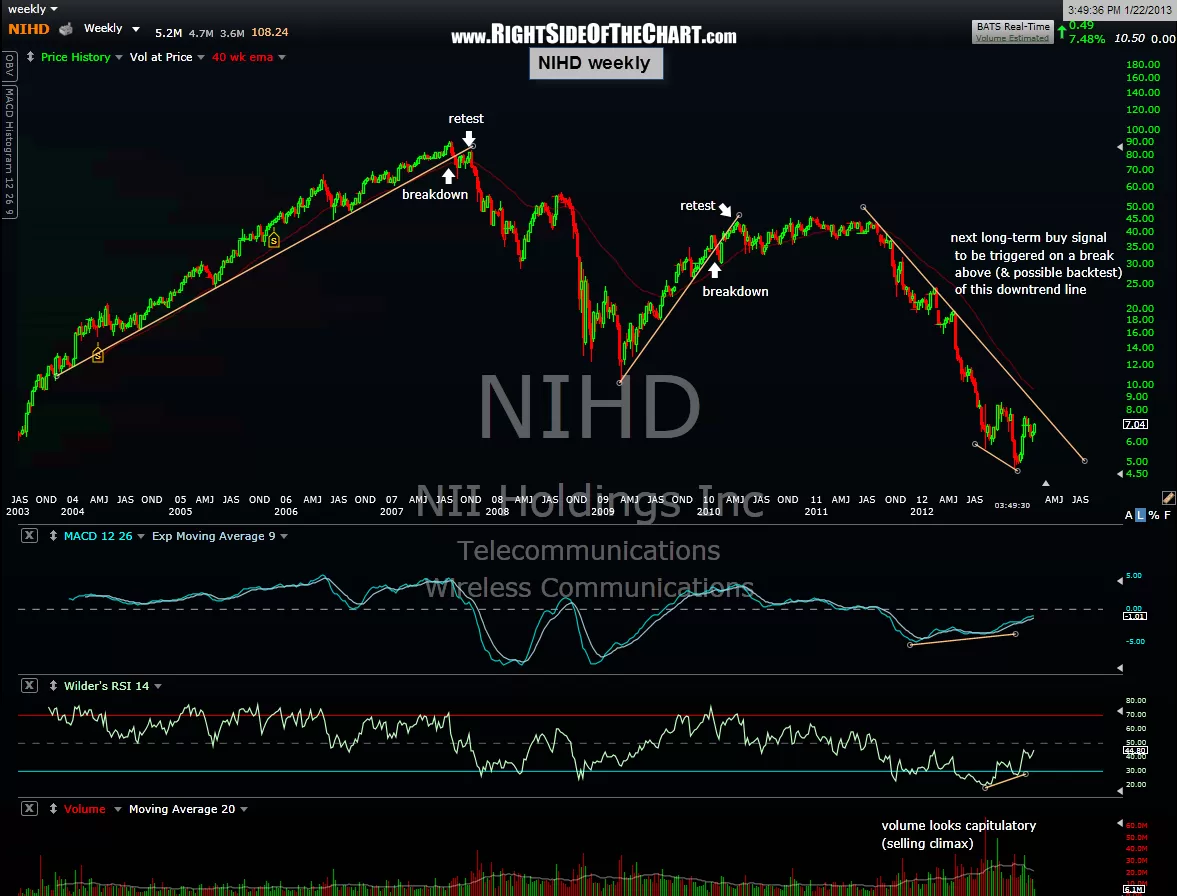
NIHD will trigger a long entry on a break above the orange downtrend line on the daily chart below. I’ve marked the first target zone as well as some of the additional overhead resistance levels but I will update the exact price target levels as soon as I have time to study the chart a little further. I am also adding NIHD as a Long-Term Trade (Investment) Idea as the weekly chart looks promising. The breakout on the daily chart and those targets (TBD) will be for the typical swing trader while a longer-term trader might consider taking a full or partial position on the same daily trigger and/or wait for a confirmed break above the primary downtrend line shown on the weekly chart below to add to the position.