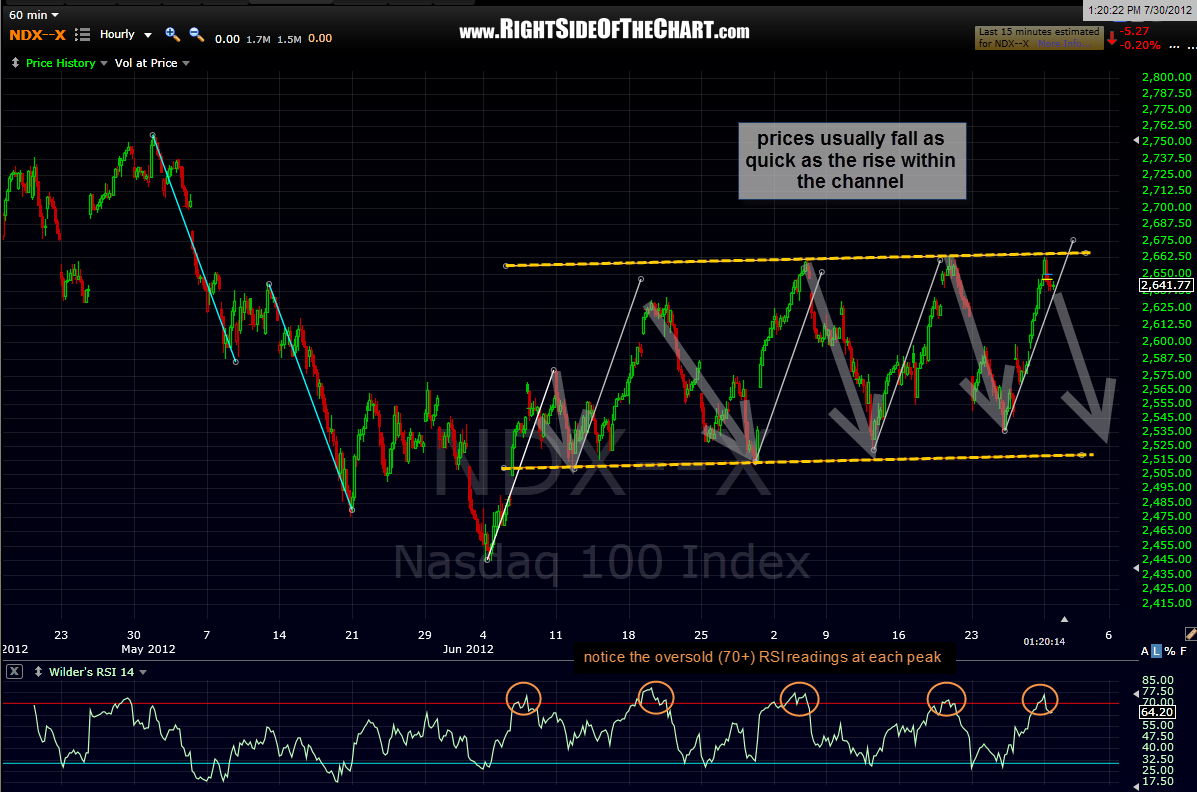
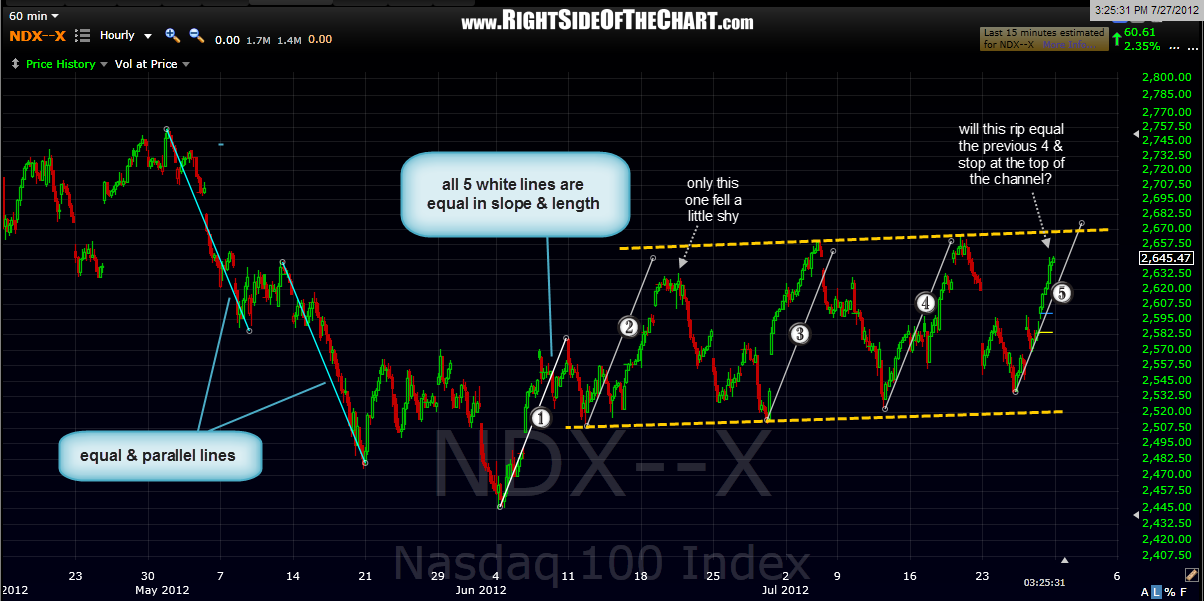
something that i didn’t point out on that recent $NDX 60 minute symmetry chart was that the end of each of those previous 4 rips (and quite possibly all 5 rips, as prices have so far reversed about where expected) was marked by oversold RSI readings (a reading of 70 or above). remember, those 5 white lines are not trendlines, just lines equal in slope and distance to help gauge where and when prices might reverse, based on recent patterns. so far today, prices reversed just shy of the projected price move as well as projected time (wednesday 11:30am ET) but still well within the expected range.
therefore, if this pattern continues then we would expect one of two things to happen going forward: 1) prices have already peaked and the selling should start to accelerate soon or 2) one more thrust higher, maybe slightly above the top of the channel before reversing and falling back towards the bottom of the channel. obviously, a more bullish scenario would be a solid break above the top of the channel but for that to happen, the market would most likely need to pullback or consolidate first, thereby relieving some of the near-term overbought conditions. i still prefer the bearish scenario (either of the two mentioned above with a slight preference to the first) but will adjust accordingly. previous and updated 60 min NDX charts below: