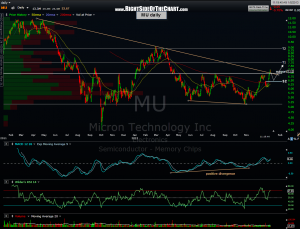
 Even though many of the semiconductor setups that I will be posting today have already broken out of their bullish patterns, I believe there is a good likelihood that they will pull back to within the pattens (failed breakouts) or at least backtest before moving much higher.
On this MU daily chart, the stock has clearly broken above both the downtrend line as well as the horizontal resistance line. However, ideally you want to see the volume on a long-side breakout at or above 150% of the average volume, which was not the case with MU or most of the recent semiconductor stock breakouts. Add to that the overbought conditions in both the stock and the broad market and you get an increase risk of the breakout failing. Again, trade these patterns as you see fit but I am only adding MU as a trade setup with a long entry (active trade) to be triggered only if we get a pullback followed by another more convincing breakout first.

