
Upon further review of the charts, I’ve made a slight downward revision to the first price target on the MSTR (Strategy Inc) long swing trade that was entered off yesterday’s low after the final downside swing target was hit. As you can see from the 60-minute chart below, MSTR has a resistance zone that comes in around 150.30-154.70. As always, best to set your sell limit order(s) slightly below the actual resistance level(s) you are targeting. The price targets I add to the charts are the actual resistance levels on long trades (support level on short trades).
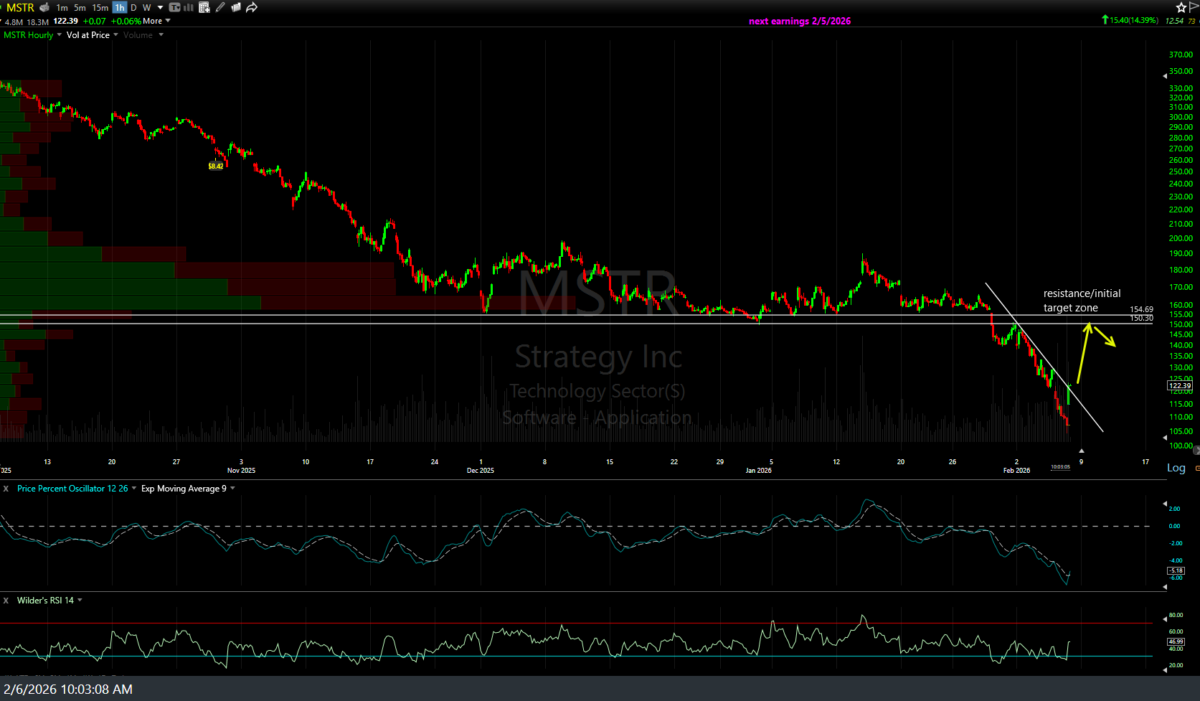
MSTR 60m Feb 6th
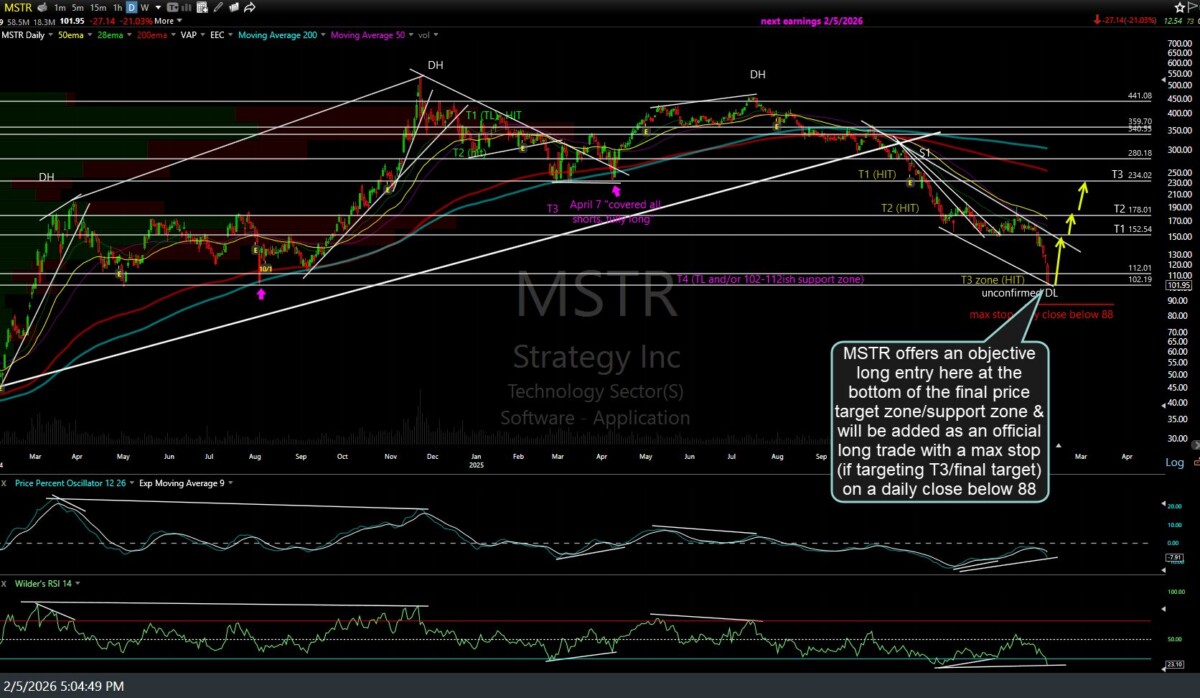
Previous & updated (with revised T1) charts of MSTR below.
MSTR daily 2 Feb 5th

MSTR daily Feb 6th