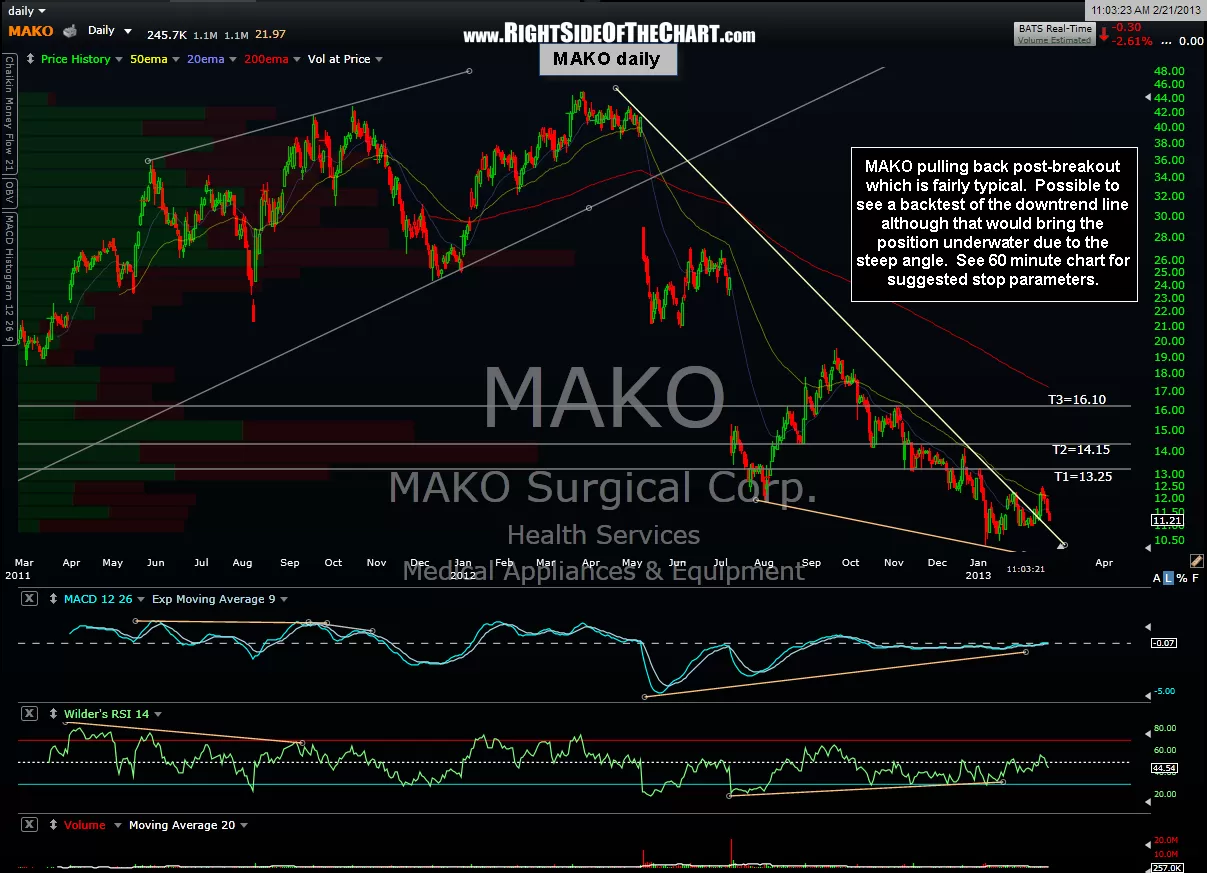
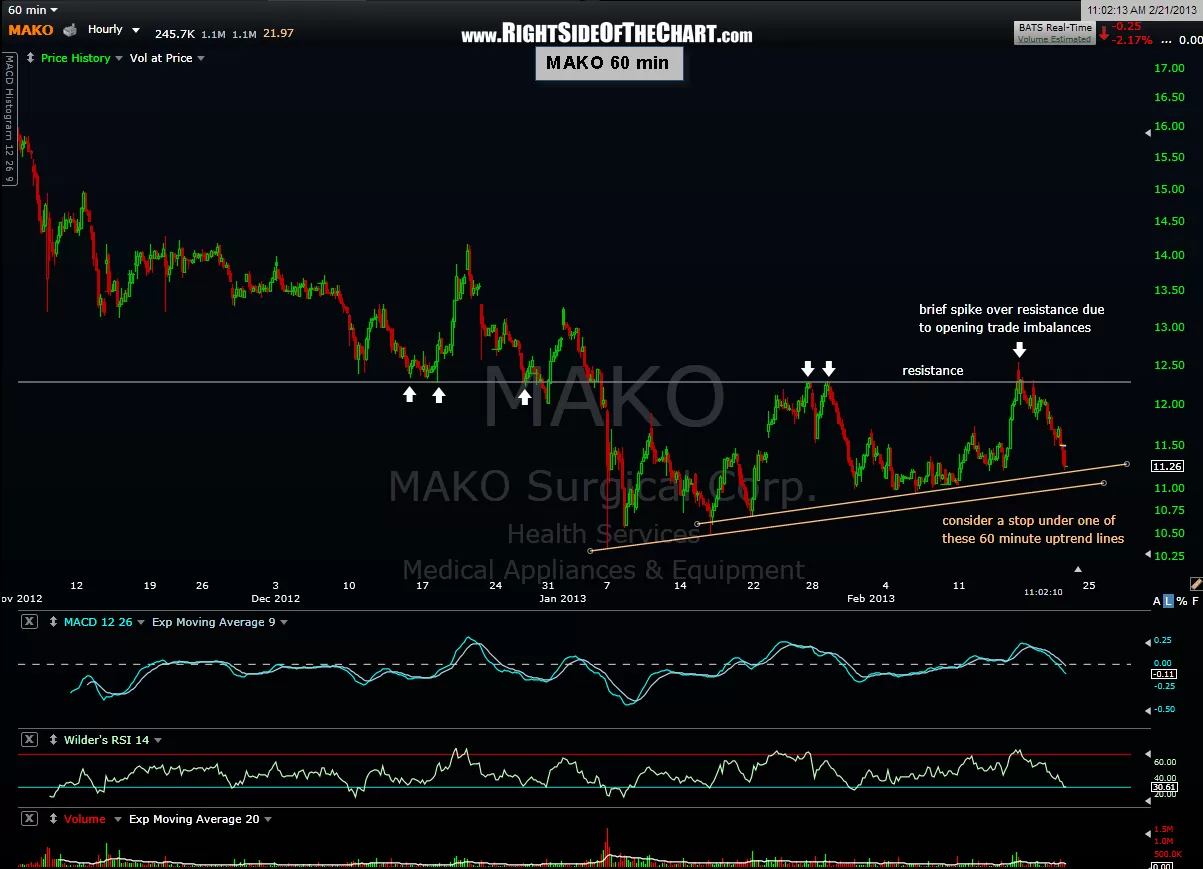
Updated daily & 60 minute charts of the MAKO active long trade below. So far, the stock has pulled back, retracing all of the post-breakout gains and might be headed for a backtest of the wedge. Due to the steep angle of the downtrend line, holding out for a full backtest, which may or may not be successful, would bring the position underwater by a fair amount. This might be fine for any longer-term traders following a similar trading plan to the one originally posted with this trade (take a small position on the breakout to allow room to continue scaling into the position on another possible move back down to the 10.50 – 10.00 weekly support level). Shorter-term traders or those preferring to limit any losses in the position might consider a stop slightly below one of these uptrend lines added to this 60 minute chart. As mentioned before, MAKO was unable to make a solid break above the 12.30 resistance level which still remains the next buy signal although a move back down to the 10.00- 10.50 weekly support is also an objective area to add to or initiate a position (with the appropriate stops not too far below).

Results for {phrase} ({results_count} of {results_count_total})
Displaying {results_count} results of {results_count_total}