
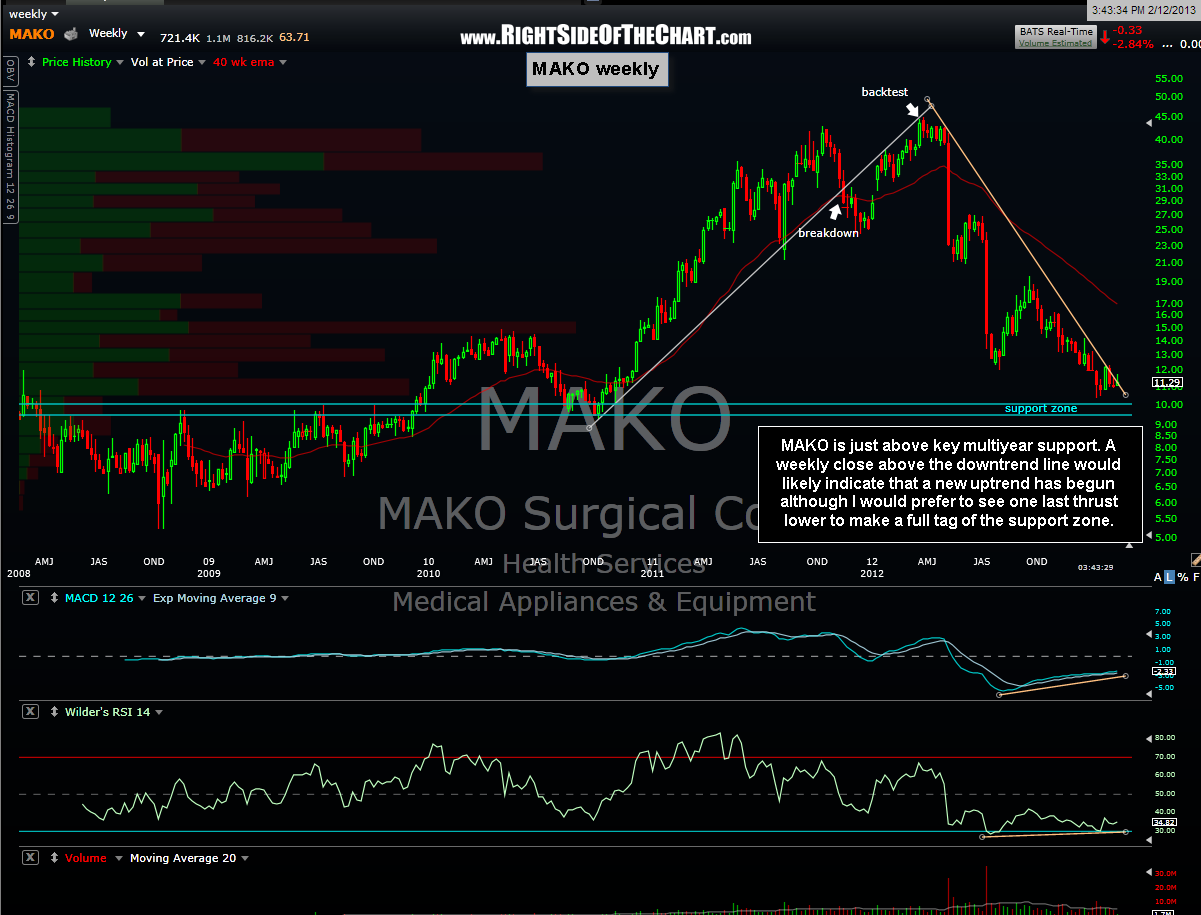
 I’ve been eying MAKO for a long time, waiting for an objective re-entry on the long-side (I sold out of my long-term position early last year) and we finally seem to be getting close. As this weekly chart shows, MAKO has come a long way from it’s highs and recently fell as low as 10.35, which is only about 30 cents above the top of this multi-year support zone. That may be close enough to consider that level hit although I could easily see on last thrust lower to anywhere from the 9.50 – 10.00 area before MAKO pounds out a solid bottom.
 Since the stock has already come so close to that support zone, the downtrend could very well have ended recently. Therefore, my plan is to take a half-position on a solid break above the daily downtrend line (daily chart on right) while more conservative traders/investors might wait for an end-of-week close above the weekly downtrend line, allowing room to add a second and possibly third lot on a backtest of the daily bullish falling wedge pattern (top of the downtrend line). Depending on the volume and price action if & when a breakout occurs, I might also add to the position if the stock continues to move higher after a breakout. Initial targets are marked on the daily chart with T3 being my current preferred swing target.