
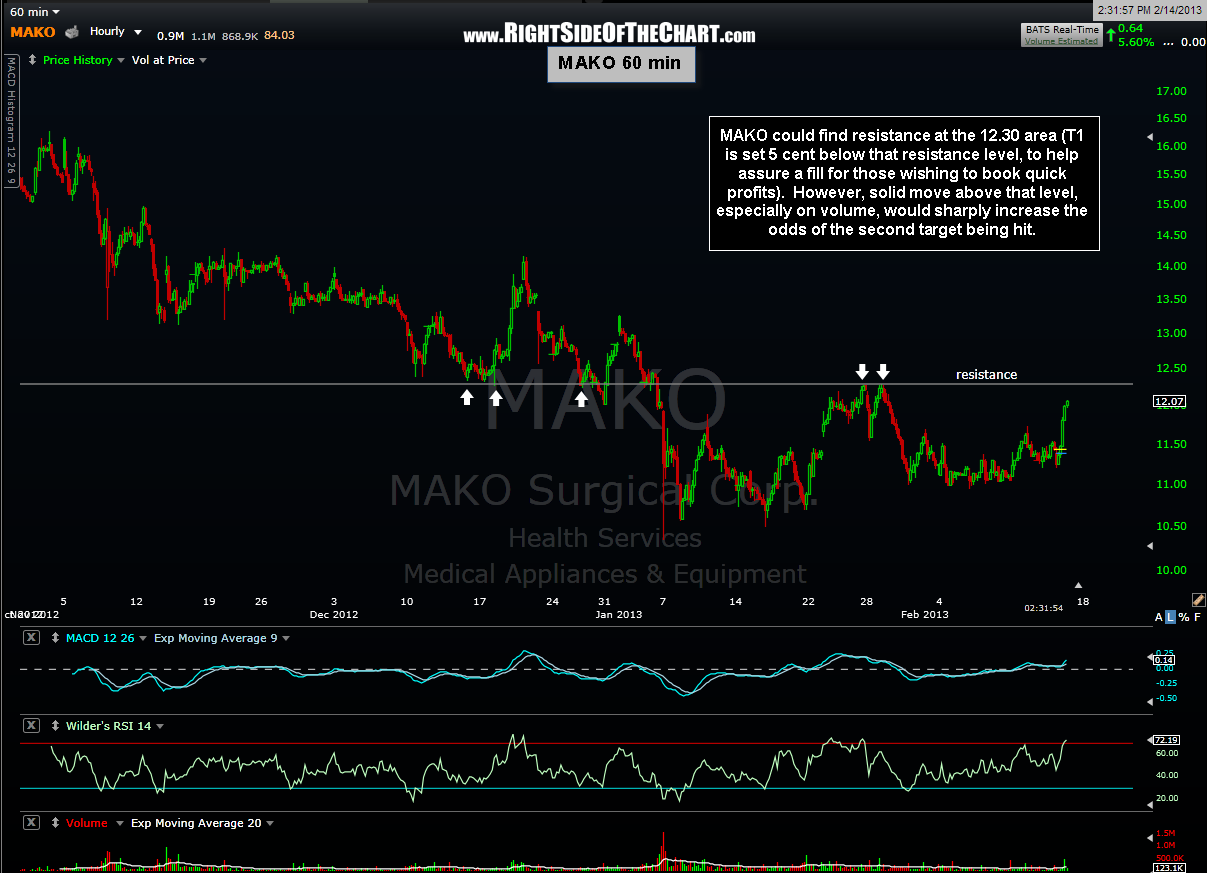
 So far the MAKO breakout is starting to look good as prices continue to move up on increasing (and now well above average) volume. Here’s a couple of intraday charts to watch. This first chart is a 60 minute chart highlighting the first likely resistance area (12.30) that the stock must contend with. I set the first target 5 cents below that at 12.25 in order to increase the odds of a fill, should the stock reverse just shy of resistance. (edit: the first target for this trade is 13.25, not 12.25 as incorrectly listed on the previous daily charts). Once/if that level is taken out, the odds for the second target (14.15) being hit increases sharply. (edit: a solid break over 12.30 would increase the odds of T1 (13.25) being hit)
 This next chart is a 1-minute time frame which shows how the breakout on the daily chart aligned with this shorter-term horizontal resistance level (not surprising) and how the volume has increase sharply since. I’ve also drawn an uptrend line which could provide support (or an add-on opportunity) on pullbacks. Assuming that one entered shortly after the breakout, consider a stop below the 11.30 area. My plan is to keep the position size small enough to allow room to continue scaling into the position once/if T1 is clearly taken out or at lower prices, should MAKO decide to make one last run back down to the 10.50 to 10.00 weekly support area discussed in the original post.