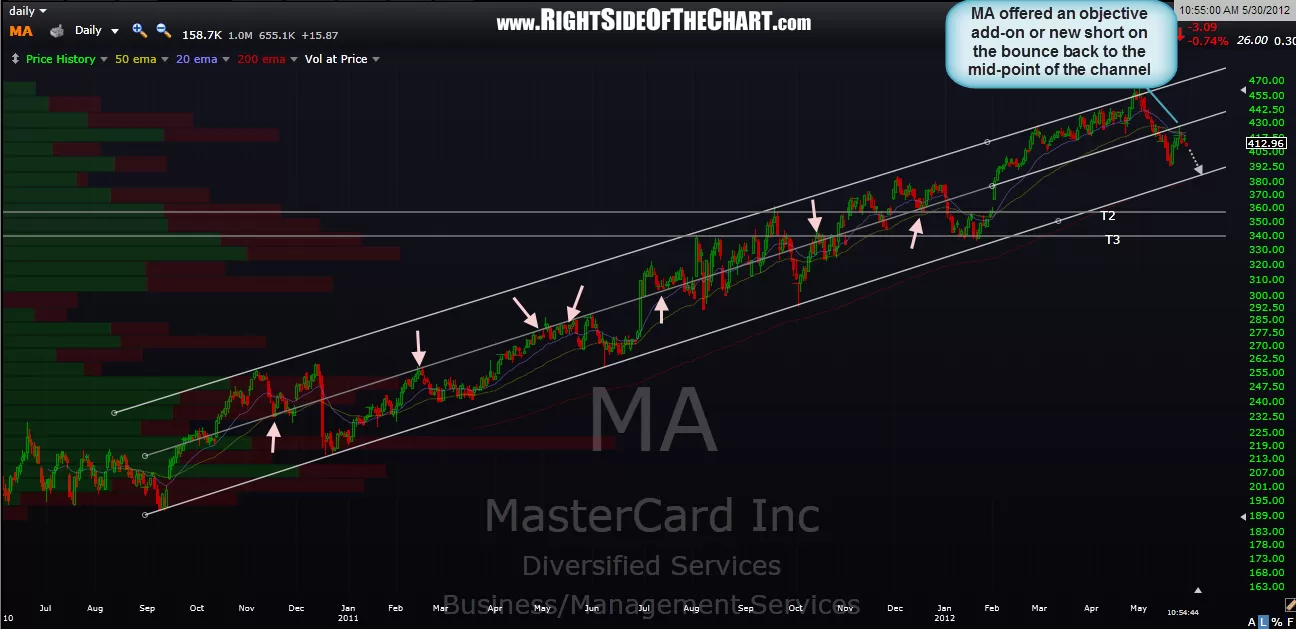
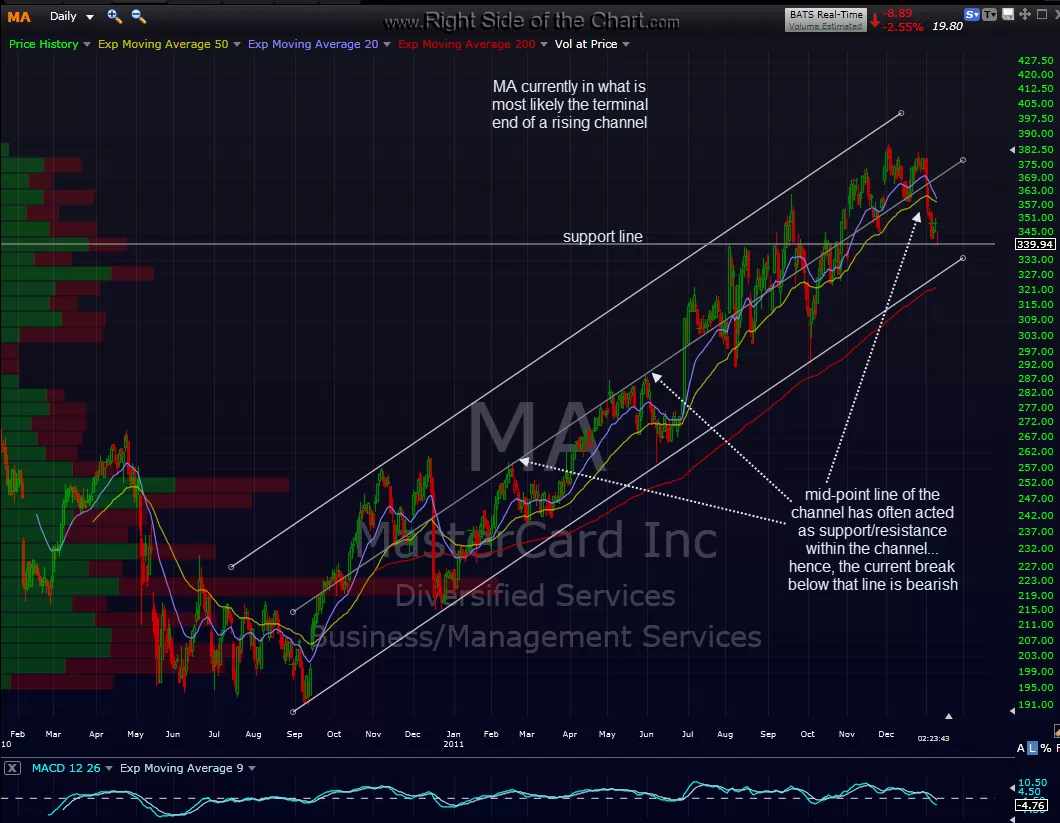
remember to take advantage of the “Posts by Symbol” drop-down box in the sidebar on the right of the page. this can be a very useful tool to reference past notes and charts on any of the active trades or set-ups posted here. for example, here’s a chart that was posted on MA back on january 11, 2012 highlighting how the mid-point line of the channel has often acted as support/resistance. MA has provided several successful trades, both long and short, from the top and bottom of that channel and is currently a short trade with the next target being the bottom of the channel. someone who had already shorted MA from the top of the channel could have used that bounce back to the mid-point to add to their swing short position while someone watching MA for a new entry could have opened a new short on that bounce to the mid-point of the channel. 2nd chart is today’s updated daily chart.

Results for {phrase} ({results_count} of {results_count_total})
Displaying {results_count} results of {results_count_total}