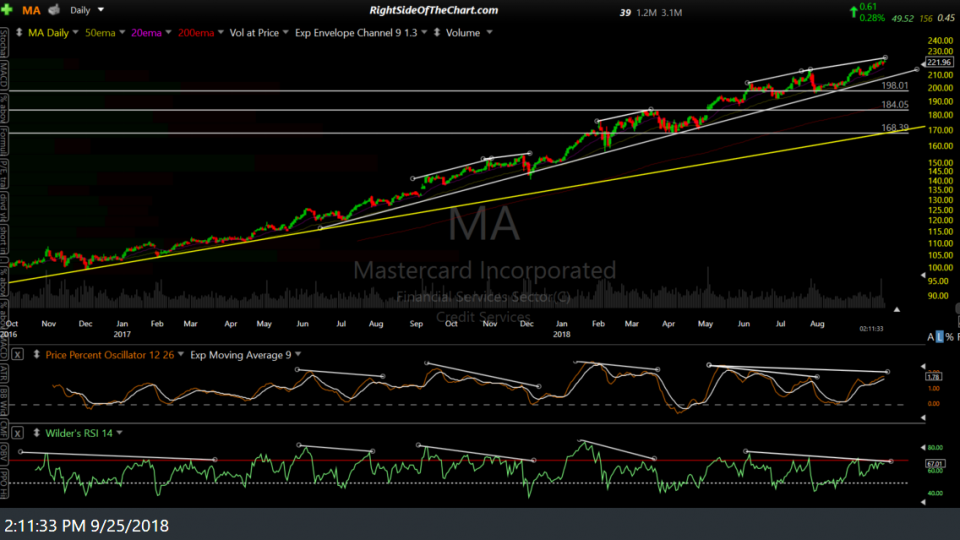
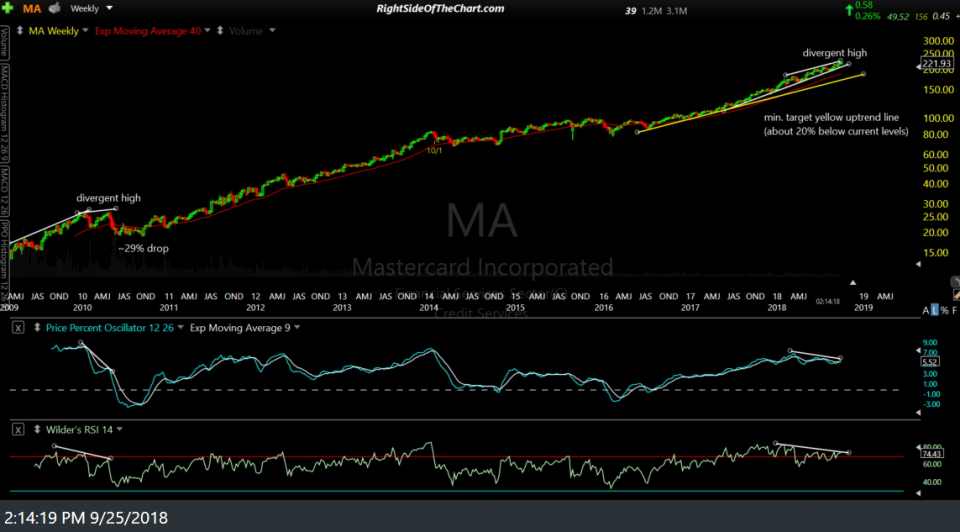
MA (Mastercard Inc.) will trigger a short entry on any break below the 228.00 support level which will have also clearly taken the stock below this bearish rising wedge pattern.
The price targets for this potential trade (remember, a trade setup is NOT an active trade, merely a potential trade awaiting an objective buy or sell trigger) are T1 at 210.05, T2 at 198.29 and T3 at 184.30 with the potential for additional price targets to be added, depending on how the charts of MA & the broad market develop going forward.
The maximum suggested stop for this trade is any move above 241.00* with a suggested beta-adjusted position size of 1.0 for the trade. *Max. suggested stop if targeting the final target, T3. Consider using a lower stop if only targeting T1 or T2, ideally using a R/R of 3:1 or better.
- MA daily Sept 25th
- MA weekly Sept 25th
MA put in a major top back on Oct 1, 2018, just 4 trading sessions & about 1% after the stock was posted as a short candidate with a minimum downside target of a 20% drop to the yellow primary uptrend line. From there, the stock plunged 24% into the Dec 24th lows while putting in positive divergence on the daily chart, which provided the fuel for the 37% rally since then. MA daily & weekly charts from Sept 25th are above with the updated weekly chart below (note: I’ve slightly modified the primary uptrend line to better fit the Dec 25th reaction low since that previous weekly chart from Sept 25th).
The stock has now come full circle, once again putting in a divergent high as it did back at the Oct ’18 high. Not only does the stock have negative divergence on the daily time frame once again, but the negative divergences that were in place on the weekly chart back then not only weren’t taken out or ‘burned through’ on this thrust to a marginal new high, rather they have simply been extended & have grown much larger, thereby indicating a much larger drop if/when the tide turns again soon. Wash, rinse, repeat although once again; no breakdown, no sell signal.


