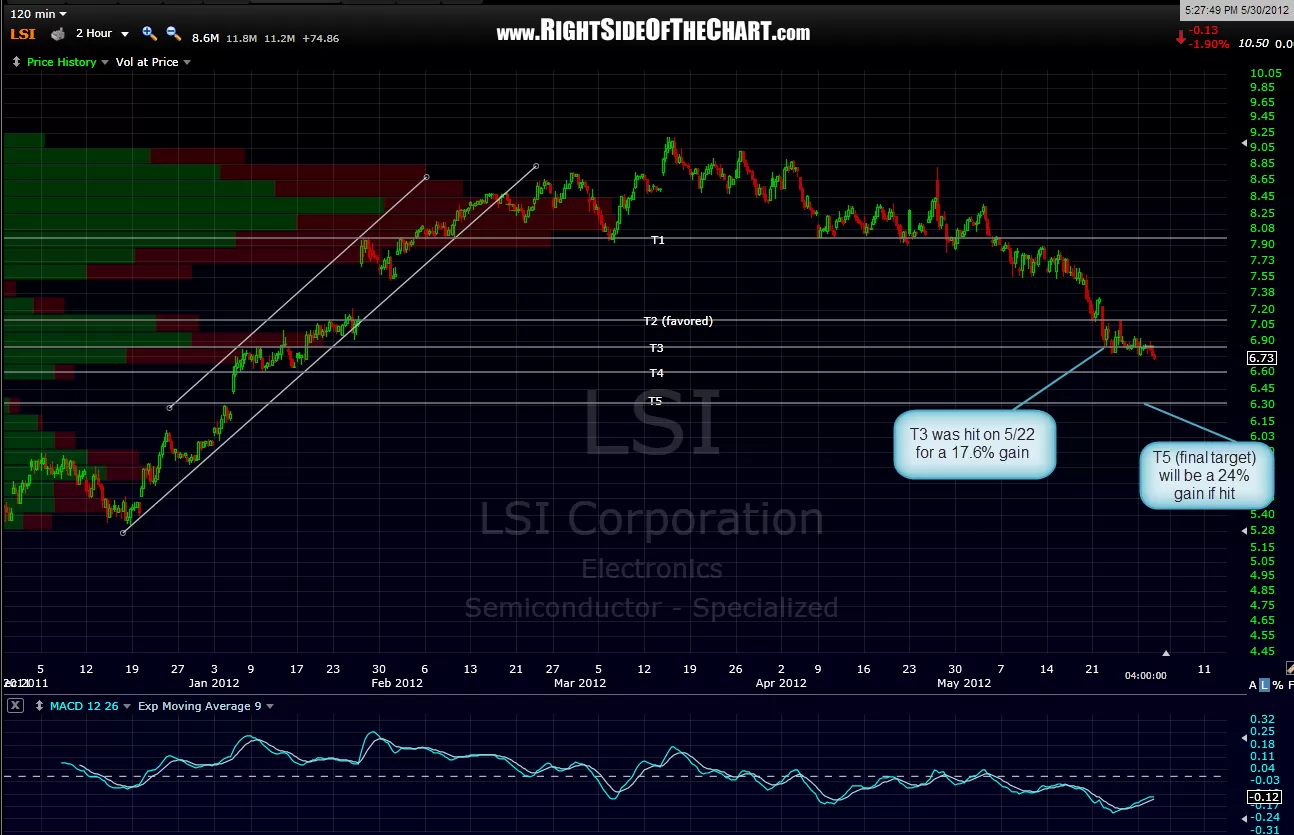
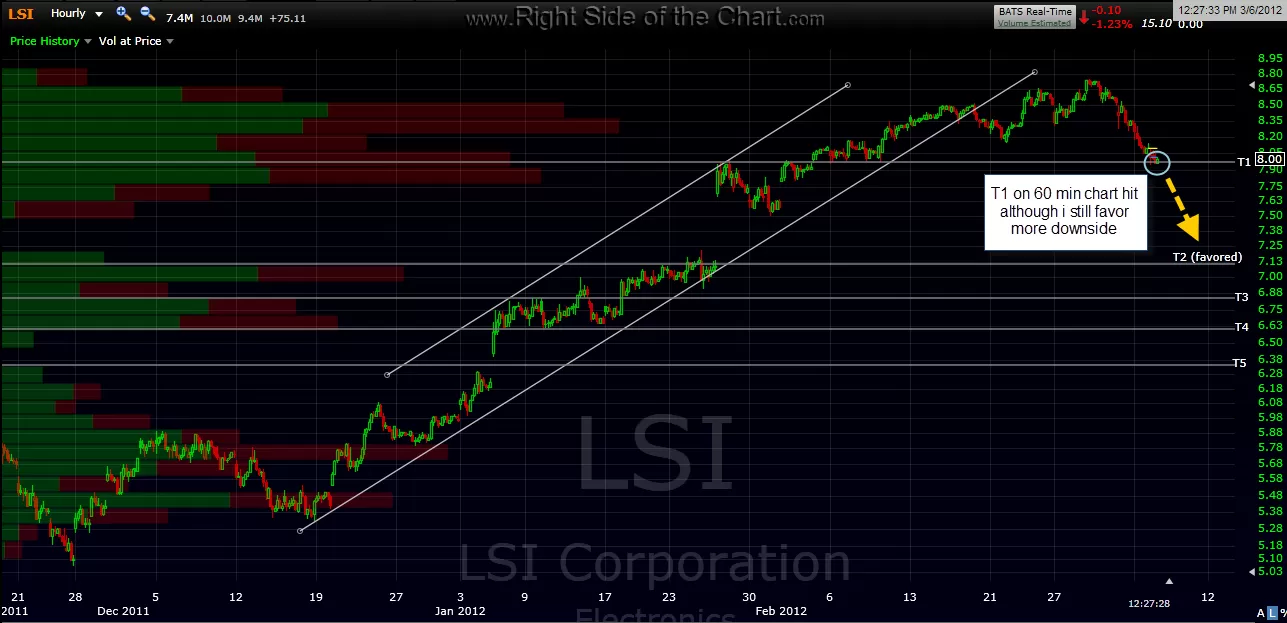
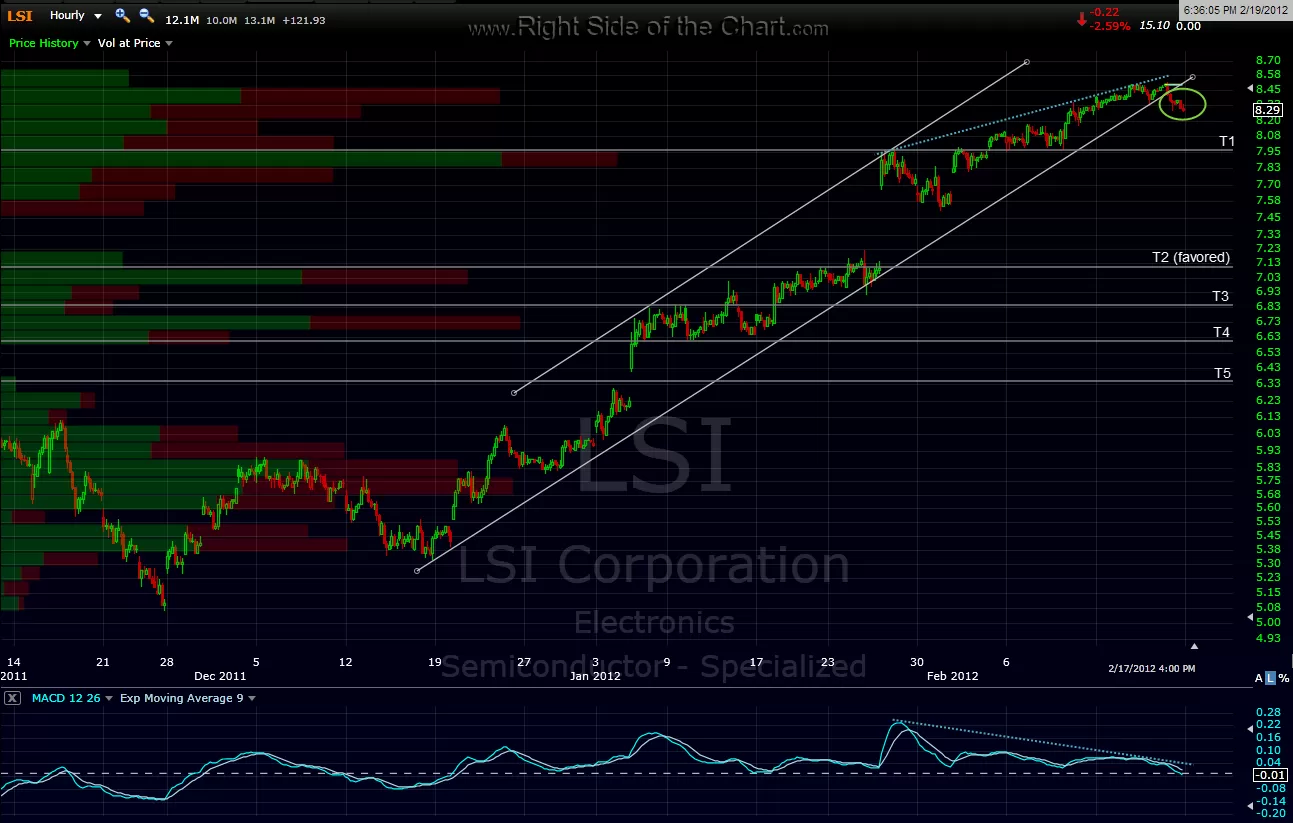
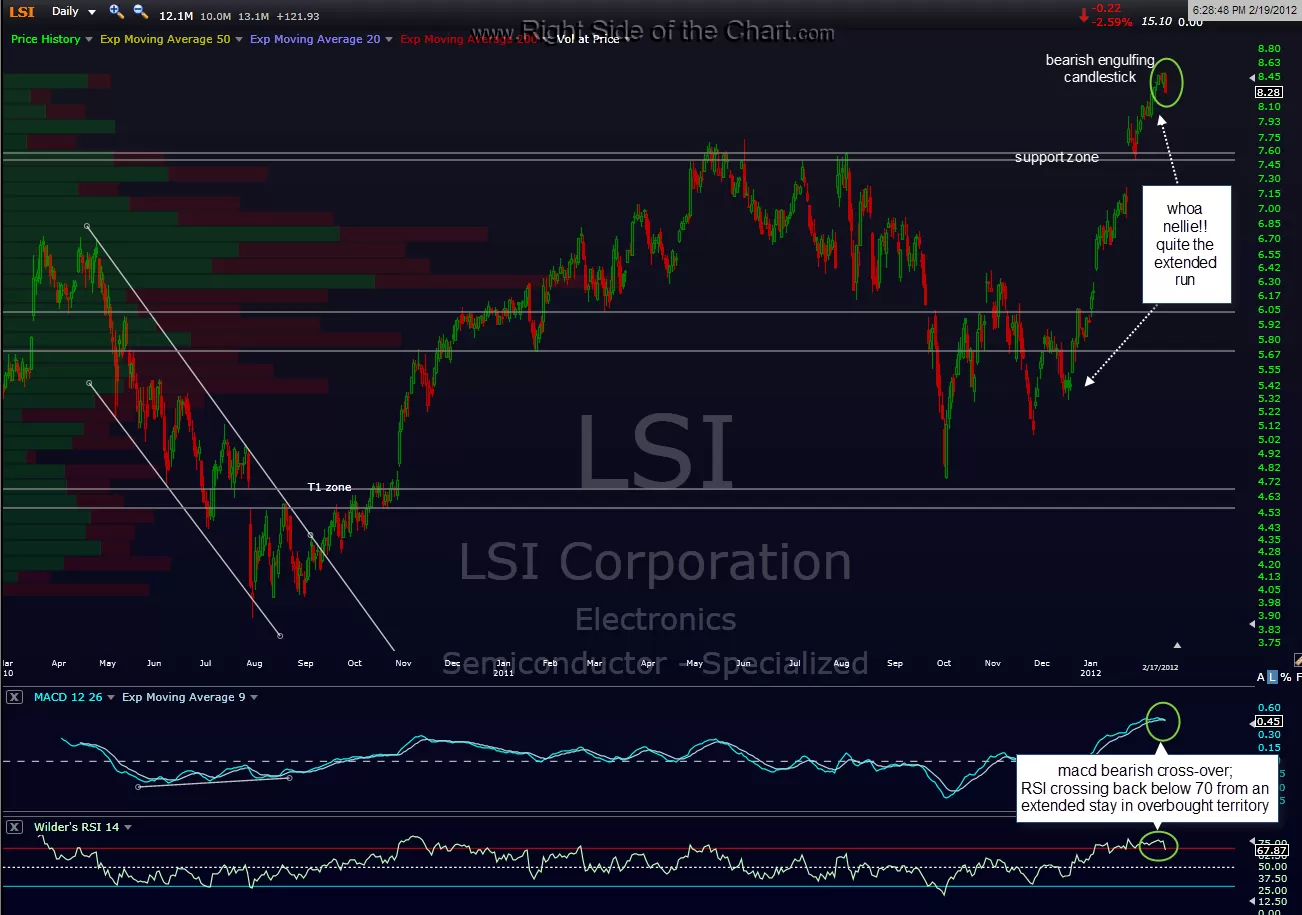
as i continue to update the active trade ideas, here’s an updated 120 minute chart for the LSI short (last chart) with the previously posted charts in chronological order for anyone who gave it some room on the bounce following the tag of the first target and is holding out for one or both of the additional targets. this trade is so far at an 18.8% gain from entry and would be a 24% gainer if T5 is hit. first chart is the original daily chart, then the 60 minute charts showing the entry then the first target hit but i zoomed out to a 120 minute chart today since this has been a swing trade going back to the original entry on february 19th.

Results for {phrase} ({results_count} of {results_count_total})
Displaying {results_count} results of {results_count_total}