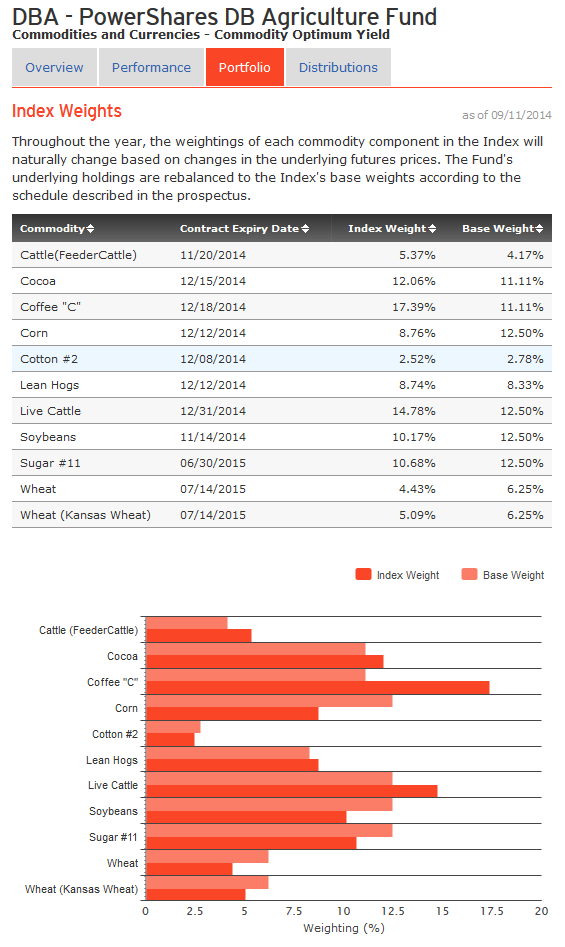
 SOYB (Soybeans ETF) will be added directly as an Active Long Trade at current levels (last trade was 20.46). I will make a case for the SOYB long trade below but keep in mind that SOYB is a thinly traded ETF and is one of several active long trade ideas in the soft commodities/agricultural industry. I also plan to likely add DBA (agriculture ETF) which holds the following stakes in various ag related commodities, including a target of 12.5% in soybeans futures. Click on this DBA holdings chart to view the complete current weightings in DBA. With plenty of liquidity and the added benefit of diversification amongst various agriculture commodities (which can also act as a drag on performance, should some of the components lag), DBA is certainly a viable option for traders or investor seeking exposure to the ag sector at this time. I’m not bullish on all of the components of DBA, hence my reasoning for posting, as well as personally going long only select agricultural commodities at this time. However, with that being said I do think the chart on DBA is setting up bullish and will cover DBA in a separate post soon.
Although one could certainly trade soybean futures in lieu of SOYB, the trade ideas on RSOTC are limited to individual stocks and exchange traded products (ETFs, ETNs, CEFs, etc…) as those are the most popular and accessible trading vehicles for the majority of traders and investors. Each individual may opt to trade futures contracts, options, or leveraged ETFs as a play on any of the trade ideas shared here. Even with the low volume on SOYB, the spreads do not seem excessive and unlike closed-end funds (CEFs), which often trade at substantial discounts or premiums to the underlying holdings, SOYB trades at NAV. With that being said, I typically prefer to use limit order vs. market orders on thin volume stocks & ETFs.
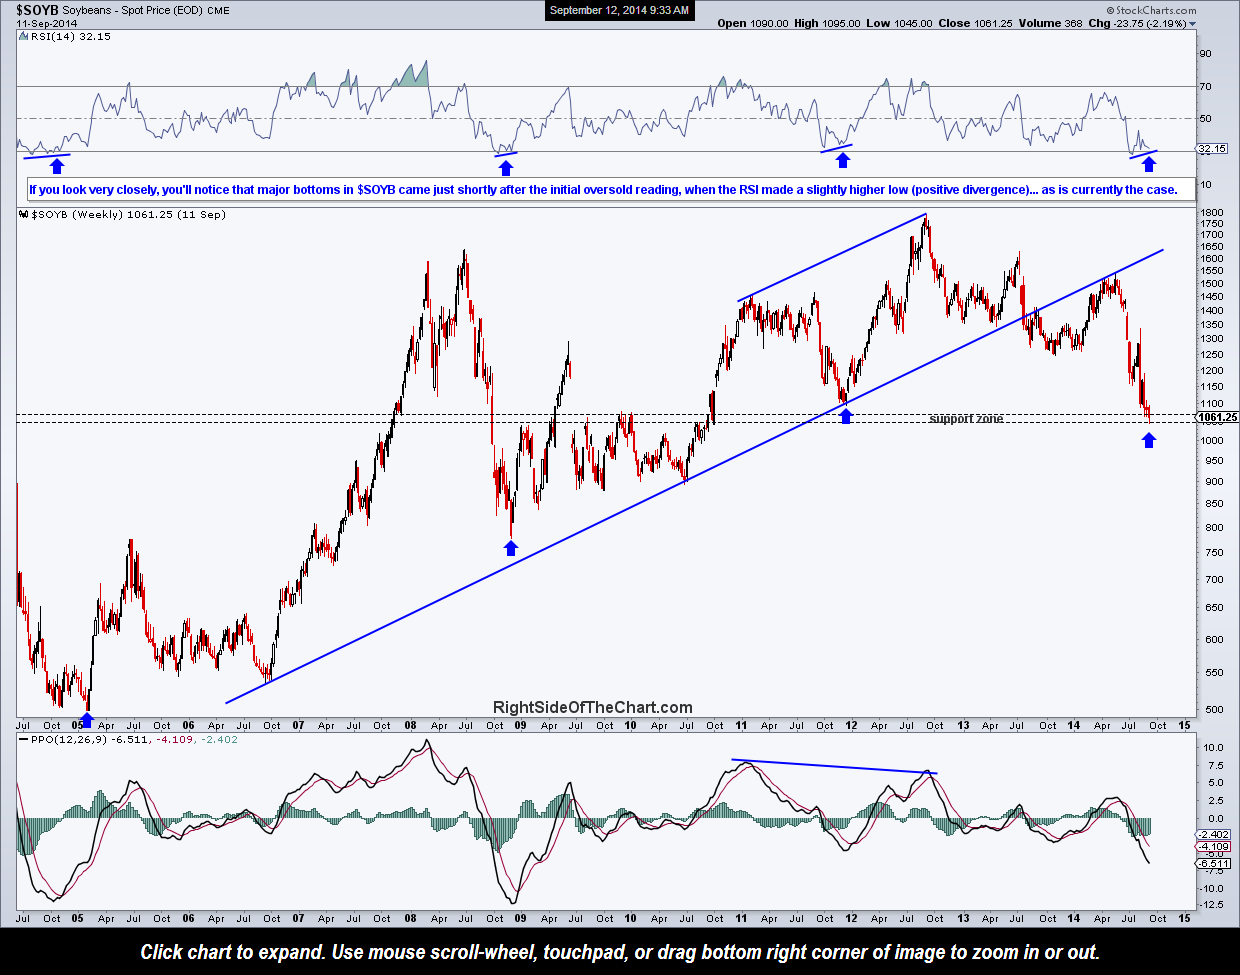
As with the recent WEAT & CORN trades, SOYB is clearly an attempt to catch a falling knife as prices have been in a powerful downtrend since peaking earlier this year. Therefore, this trade should be considered fairly aggressive until/unless we get some decent evidence of a trend reversal. Looking at the weekly chart of $SOYB (the spot price of soybeans), it appears that soybeans have fallen to the bottom of a decent support zone following a rarely seen overbought reading on the RSI 14. As this chart illustrates, very sharp rallies have immediately followed shortly after the RSI reached oversold levels. In fact, the exact bottoms did not come on the initial oversold reading but very shortly afterwards following a higher low on the RSI, such as we now have.
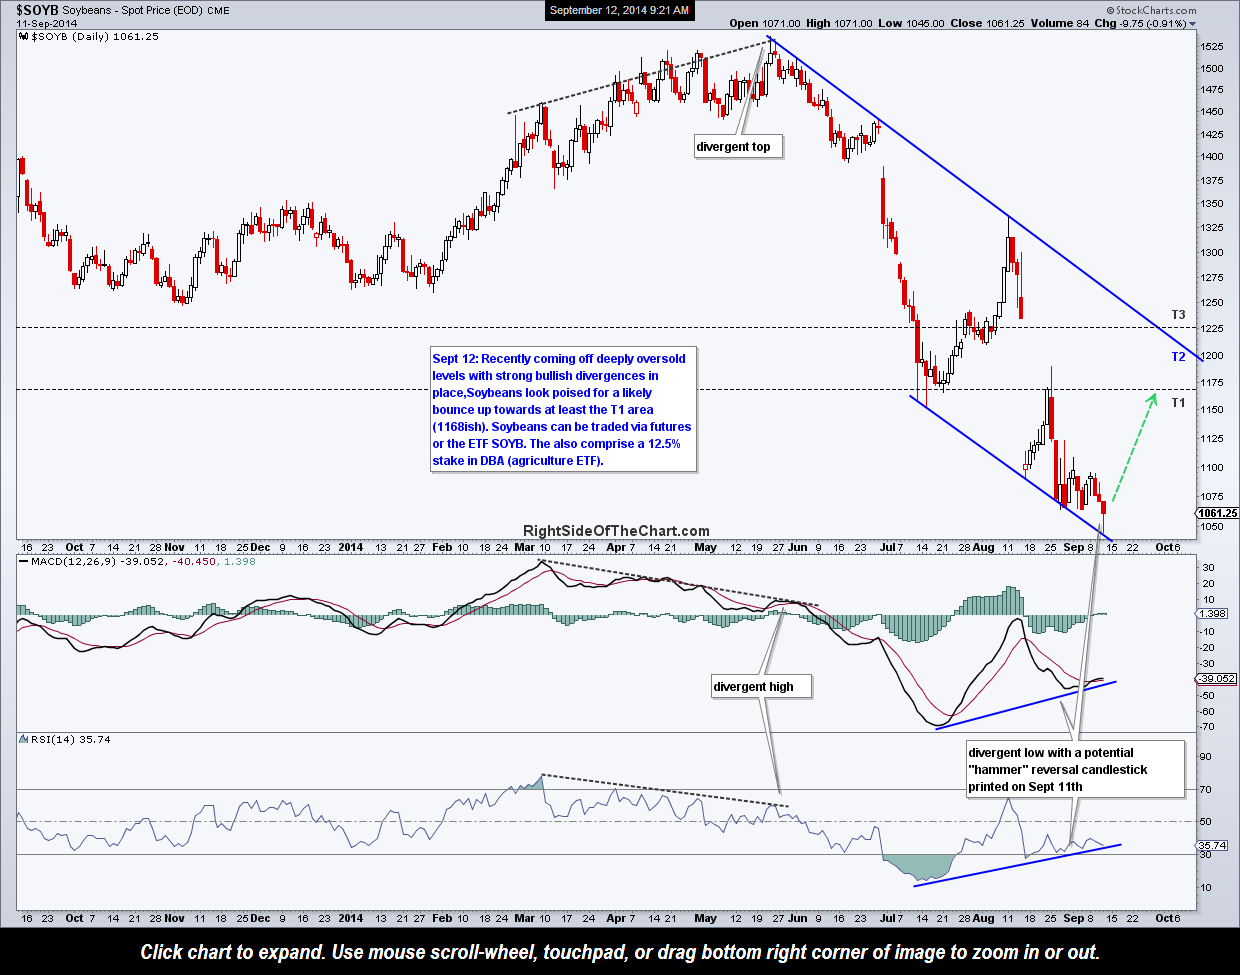
Zooming down to the daily time frame, $SOYB printed a hammer candlestick yesterday which is a potential reversal stick (pending upside follow-thru over the next few sessions). $SOYB also has very strong bullish divergences in place as it just tagged what appears to be the bottom of a descending price channel. My targets for SOYB will be roughly based off of this daily spot price chart as well as soybean futures. T1 (the 1168ish area) is my first & preferred target at this time. Depending on how $SOYB, other ag commodities and the US dollar trade going forward, I may extend my preferred target to T2 (the top of the channel/downtrend line), T3 (1225) or possibly add additional targets.