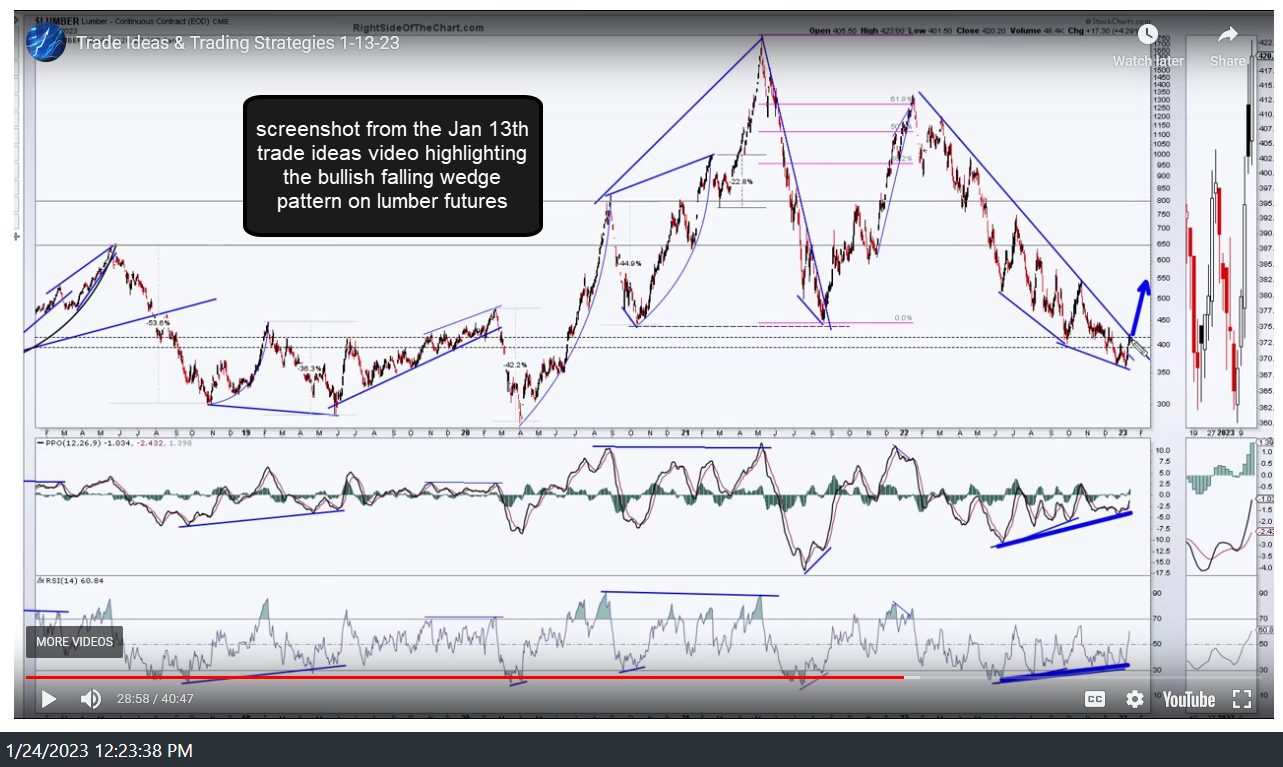
$LUMBER (/LB – lumber futures) has broken above the bullish falling wedge pattern that was highlighted on the daily time frame in the Jan 13th Trades Idea video (first chart below), triggering a buy signal. Previous (screenshot from Jan 13th video) and updated daily charts below.
Zooming out to the longer-term weekly time frame, $LUMBER recently pulled back to the primary uptrend line off the early 2009 lows. That, coupled with the bullish falling wedge & divergent low offers an objective long entry for a longer-term swing or trend trade with stops on a solid weekly close below the primary uptrend line.
Now zooming down to the 60-minute chart, following the pullback that was expected (as per the Jan 13th video) after rallying into the 440 resistance & divergent high + trendline break, /LB reversed & powered up to take out the 440 resistance (bullish). My preference at this time is to only have a starter position until & unless the potential (but unconfirmed) negative divergence on the 60-minute chart is ‘negated’ or take out via higher highs in the indicators. Should those divergences play out for a reversal soon, likely pullback targets & objective long entries or add-ons to a starter position would be the 440 former resistance (now support) and quite possibly the 410ish support.
To the best of my knowledge, there aren’t any ETFs or ETNs that directly track lumber prices. WOOD & CUT are ETFs that hold timber, forestry, & paper companies so those would be the closest match although not a direct proxy of lumber prices. /LBR is ticker for the relatively new MINI futures contract for lumber which has a smaller multiplier (1/4th of the leverage) than /LB (27.5 vs. 110 for /LB). The total value (amount of $$ exposure) of a futures contract is its current price X the multiplier. e.g. One contract of /LB at current prices accounts for a $50,480 position. Liquidity is relatively thin in lumber futures & prices are very volatile so best to take a smaller than usual position size or pass if not your cup of tea.


