
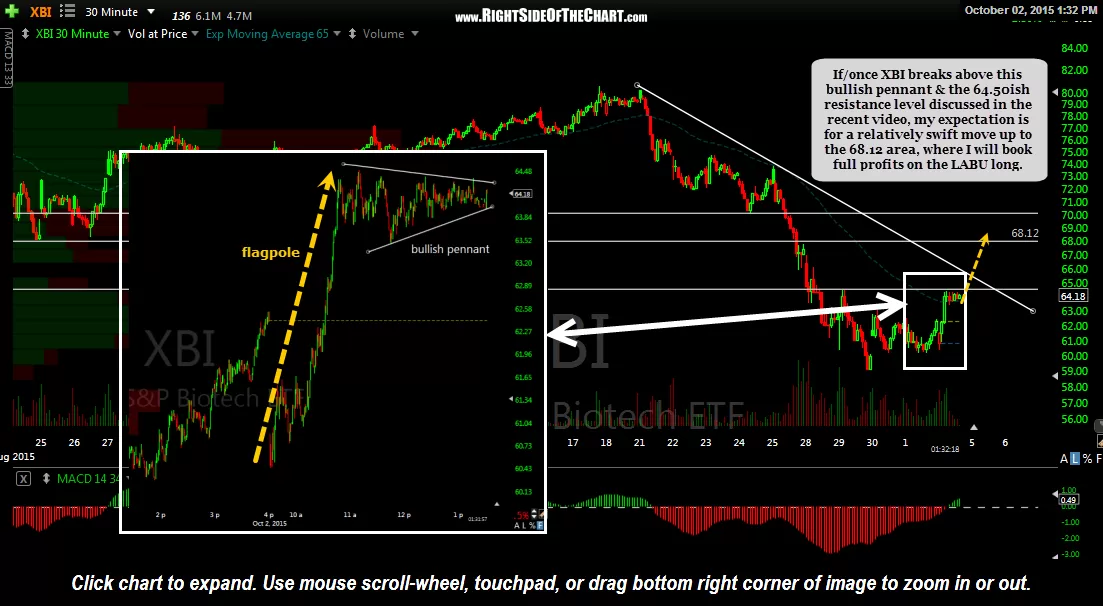
I haven’t had much time to update the trade ideas lately but wanted to share my thoughts on the current LABU (3x long biotech etf) Active Long Trade. In this previous trade update on Oct 2nd, I finalized the price target on LABU at 21.50. As usual, I was focusing on the charts of the non-leveraged (1x) counterpart which is XBI (SPDR S&P Biotech ETF), expecting a quick move up to the 68 area following a likely breakout above the bullish pennant formation that I was watching at that time but in trying to keep things simply this time around, I posted the official price target trying to estimate where LABU would be instead of just using the 1x ETF to determine the price target as I normally do.
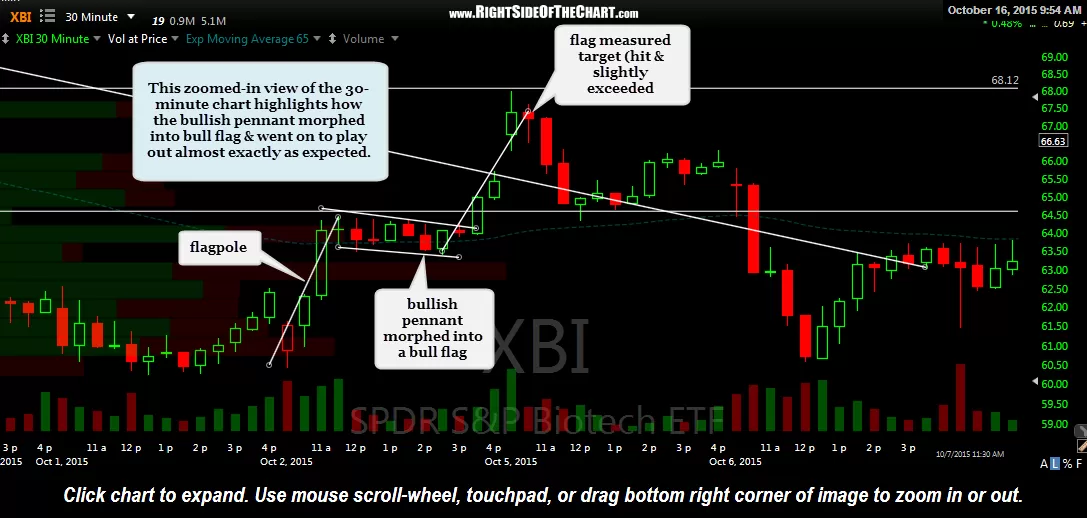
Shortly after that last update, XBI moved a hair below the pennant formation which essential morphed the pattern into its very closely related cousin, the bull flag continuation pattern. From there, prices broke out to the upside and as is so often the case, in a sharp move higher almost perfectly mirroring the flag pole (i.e.- the sharp move leading up to formation of the bull flag), with XBI printing a high of 68.02 and LABU a high of 21.08. Essentially, XBI hit my target area but I had miscalculated (plus LABU is notorious for both short-term/intraday pricing disparities between both XBI & its 3x inverse counterpart, LABD, not to mention rather large spreads at time which can add to the disconnects).
My mistake for not officially closing the LABU long back then which would have resulted in 6 day gain of over 30%. However, LABU has come full circle after the pullback following the XBI tag of the 68ish resistance level it nearly back to that level again, trading as high as 67.54 so far today. I will leave the 21.50 price target on LABU in place for now but with the official stops raised to any move below 18.35 on LABU, which will help to assure a profit (barring any unusually large opening gap below that level and the original entry on Sept 29th). I should also add that it might be prudent to use a more aggressive stop as well as the bounce in the biotechs may have already run its course.
-
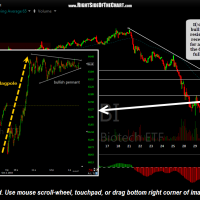
- XBI 30 minute Oct 2nd
-

- XBI 30 min zoom-in Oct 16th
-
- XBI 30 minute Oct 16th
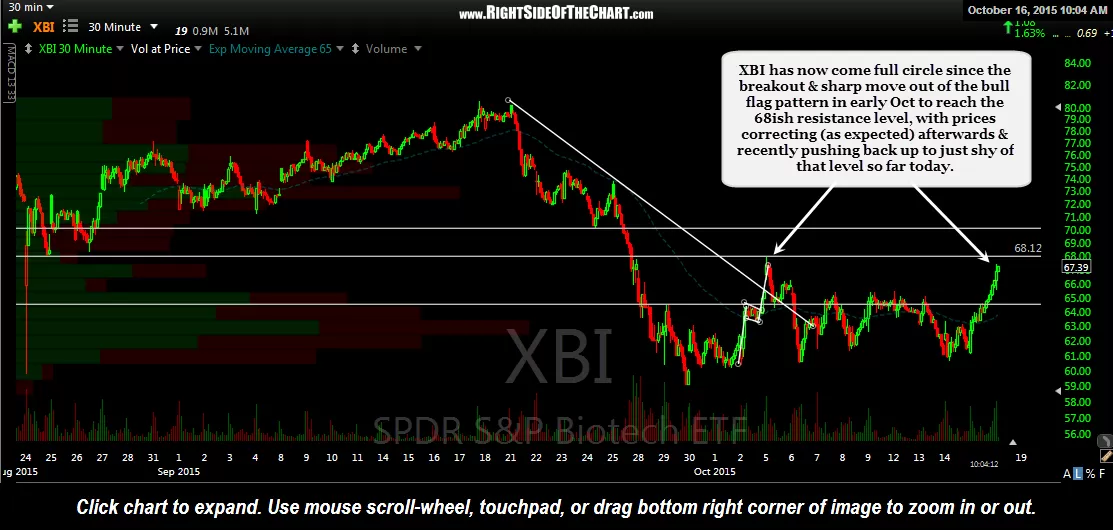
The charts above are the 30 minute chart from the previous update on Oct 2nd followed by the updated 30 minute chart, plus a zoom-in showing how that bullish pennant morphed into a bull flag before playing out exactly as expected.