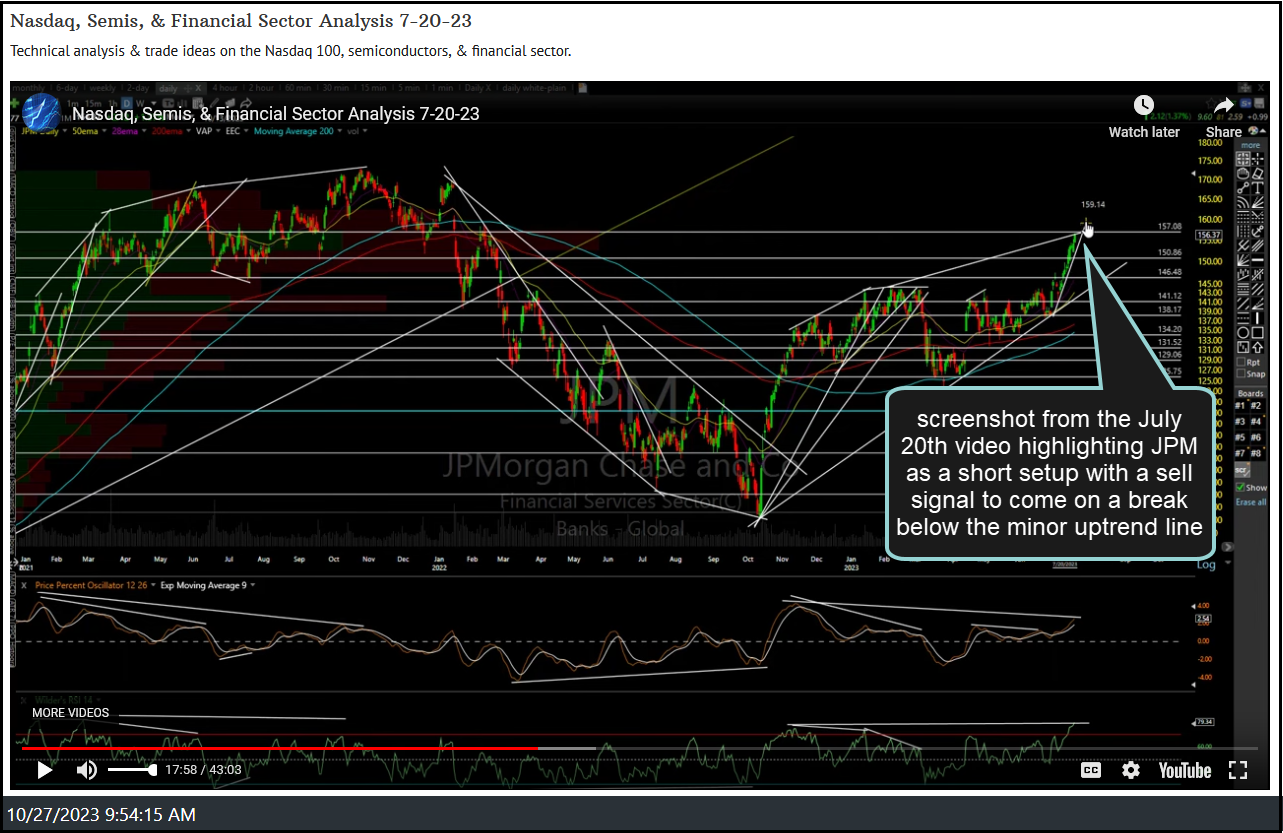
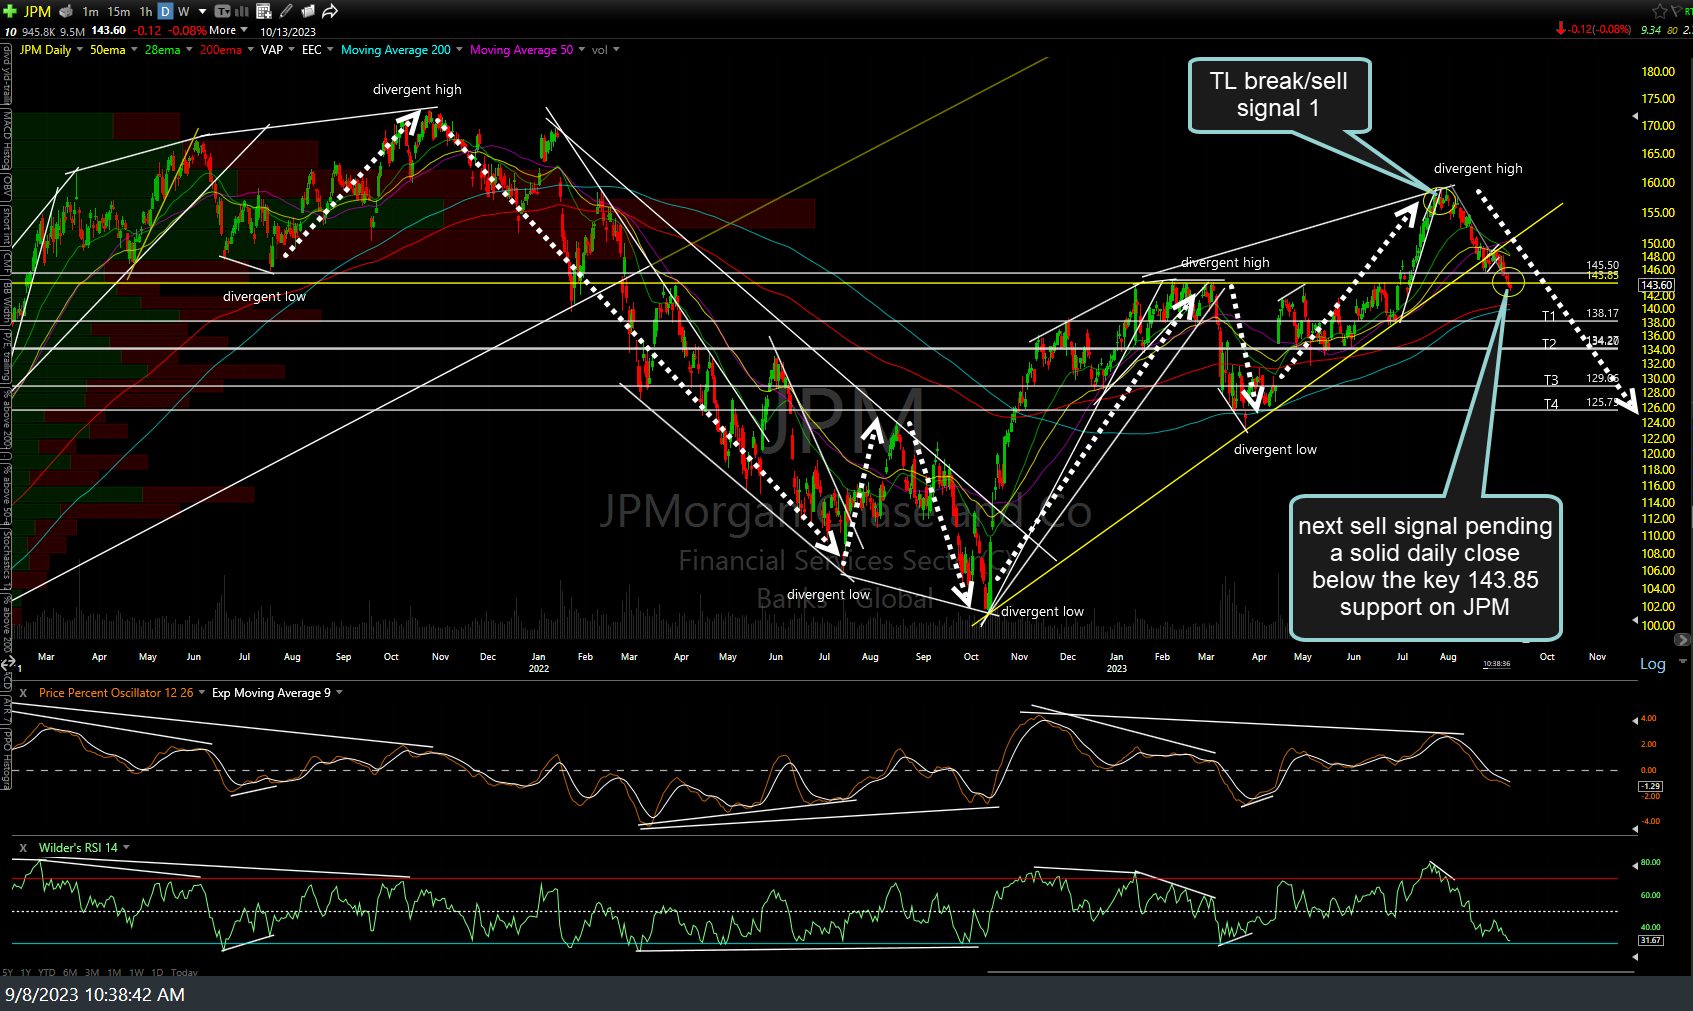
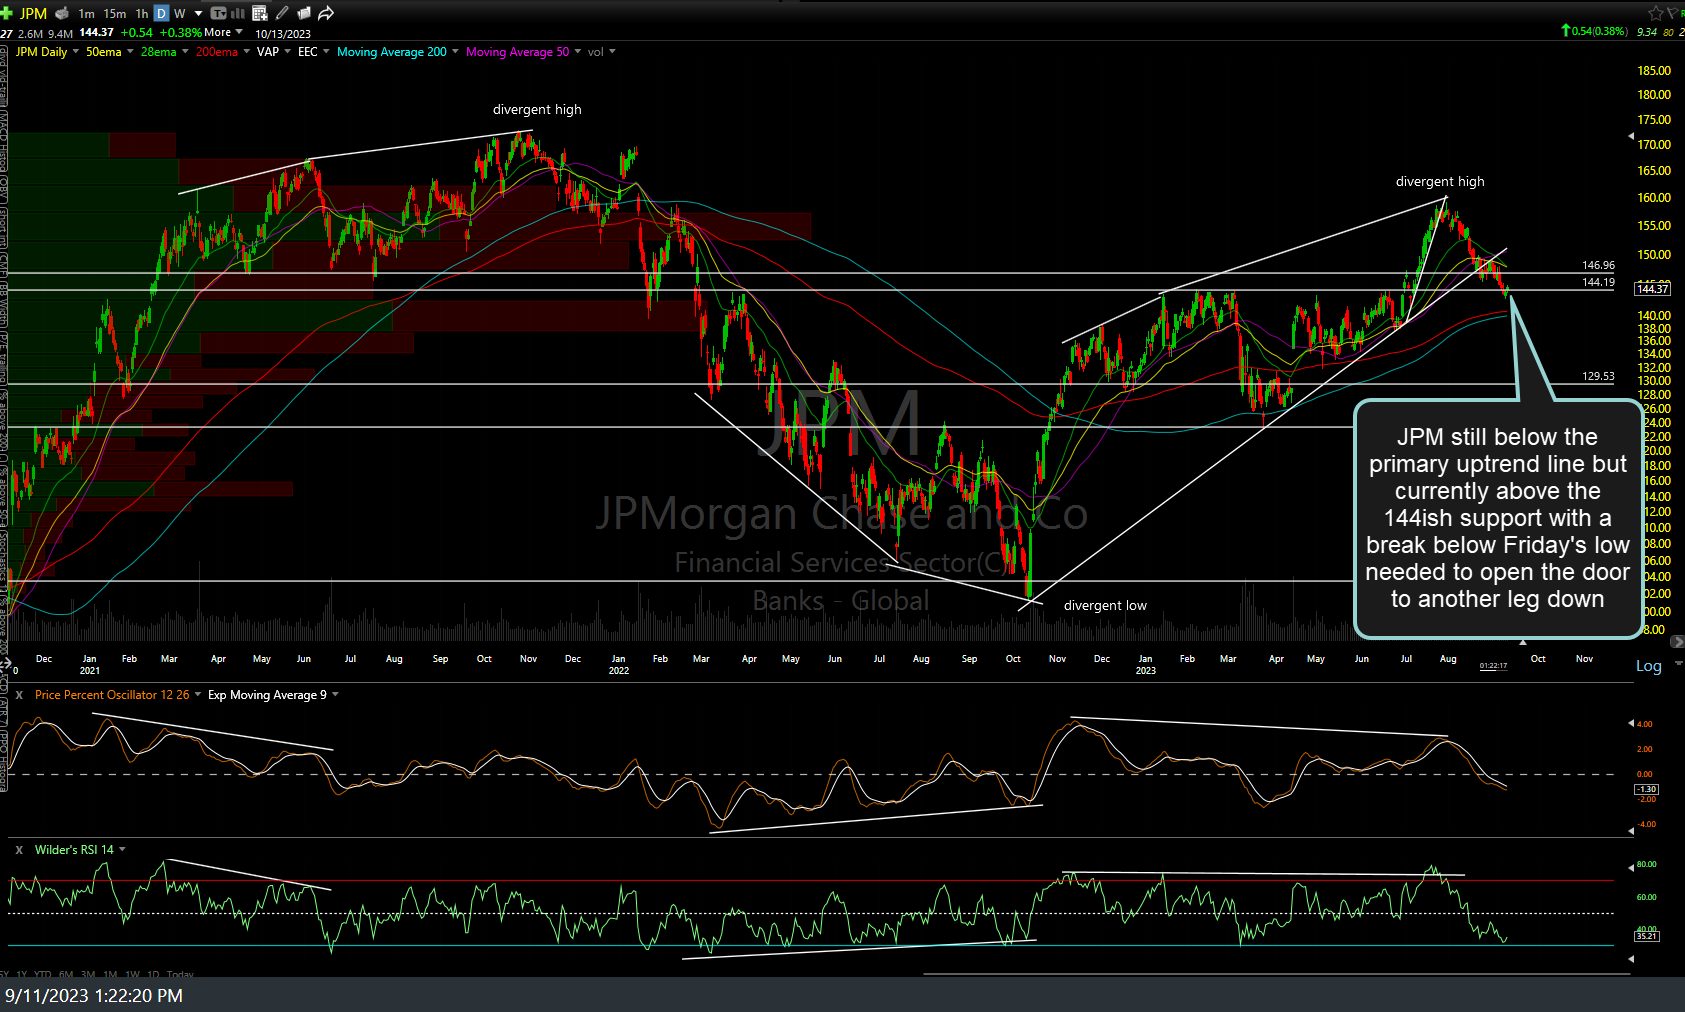
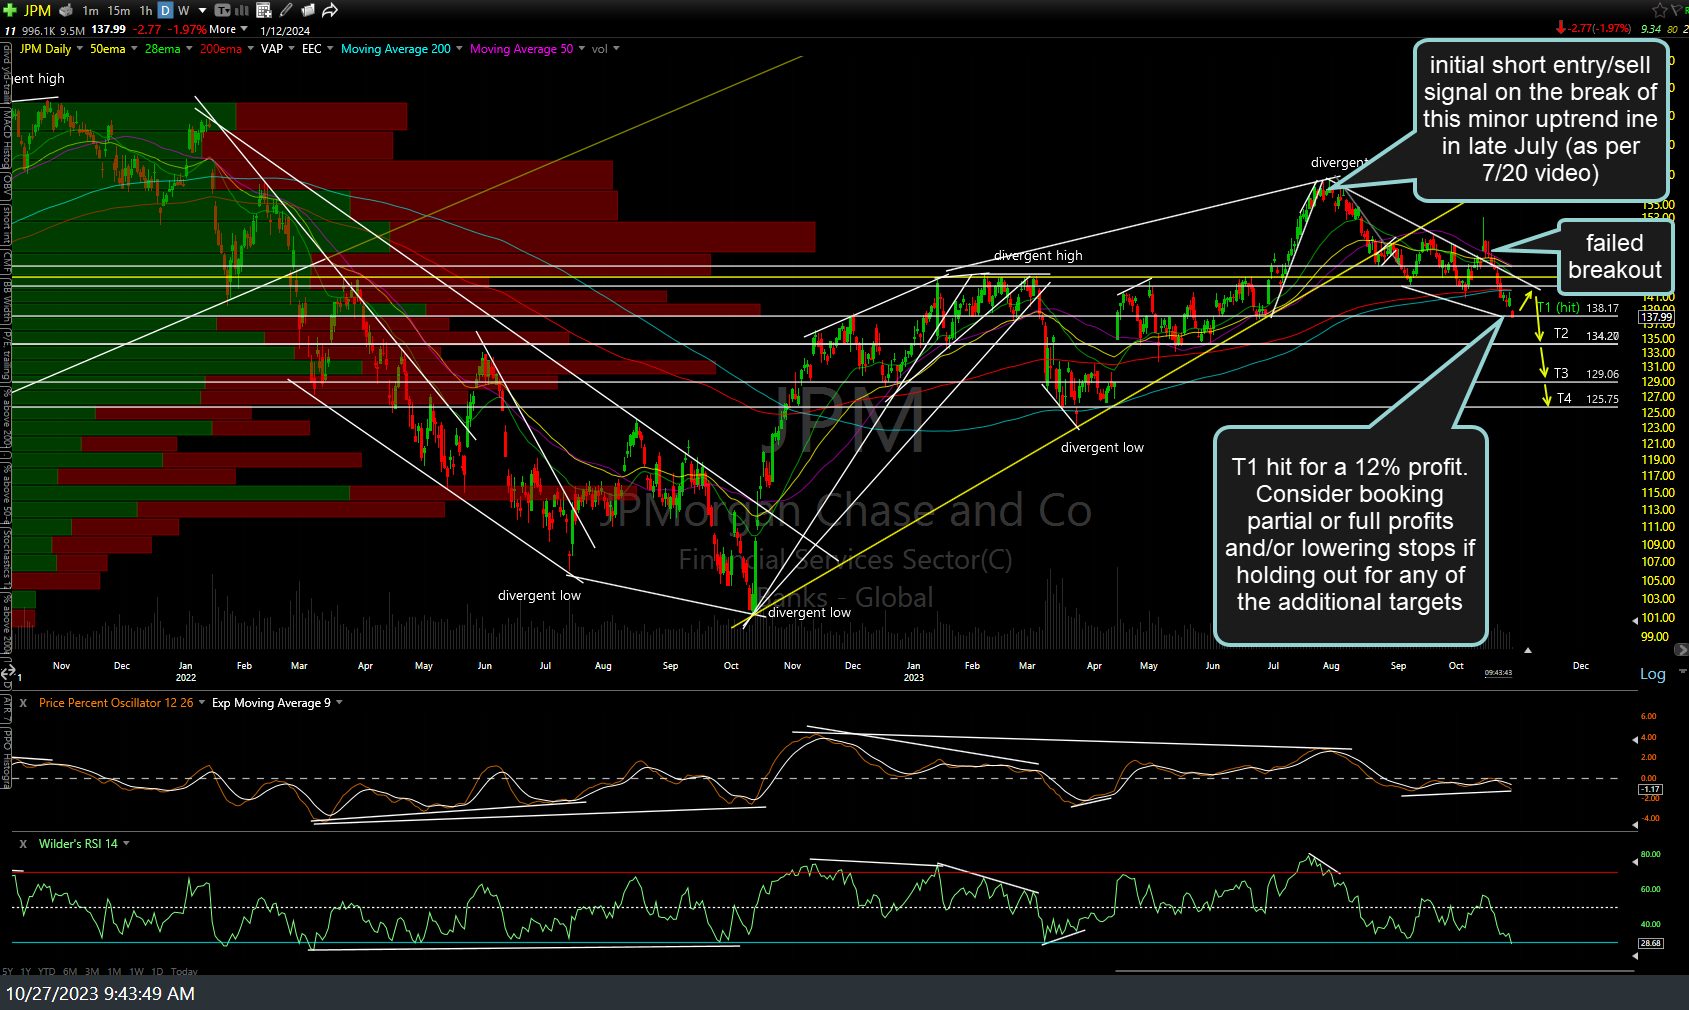
The JPM (JP Morgan Chase & Co) long-term swing/trend trade, first posted in this July 20th trade ideas video as a setup with a sell signal to come on the minor uptrend line (which triggered shortly afterward) has just hit the first downside trend target (T1) for a 12% profit. (Not to be confused with the recent counter-trend rally/bounce trade). Consider booking partial or full profits and/or lowering stops if holding out for any of the additional targets. Previous (July 20th video screenshot along with the Sept 8th & Sept 11th charts) and updated daily chart below.
Nothing has changed on my very near-term (bullish, at least for today & quite likely early next week… although far from locked into that view) or longer-term (bearish… still pretty convinced of that one at this time) outlook for the stock market. A quick glance at the charts of the largest bank helps paint the bigger picture of what a bear market initial leg down (late 2021 to mid-Oct 2022), subsequent bear market rally (mid-Oct ’22 to July 31st) and start of the next leg down (Aug 1 – current) looks like. The stock market doesn’t go straight up or down so I’ll continue to do my best to post objective entries & exit points in order to help navigate all the zigs & zags along the way.


