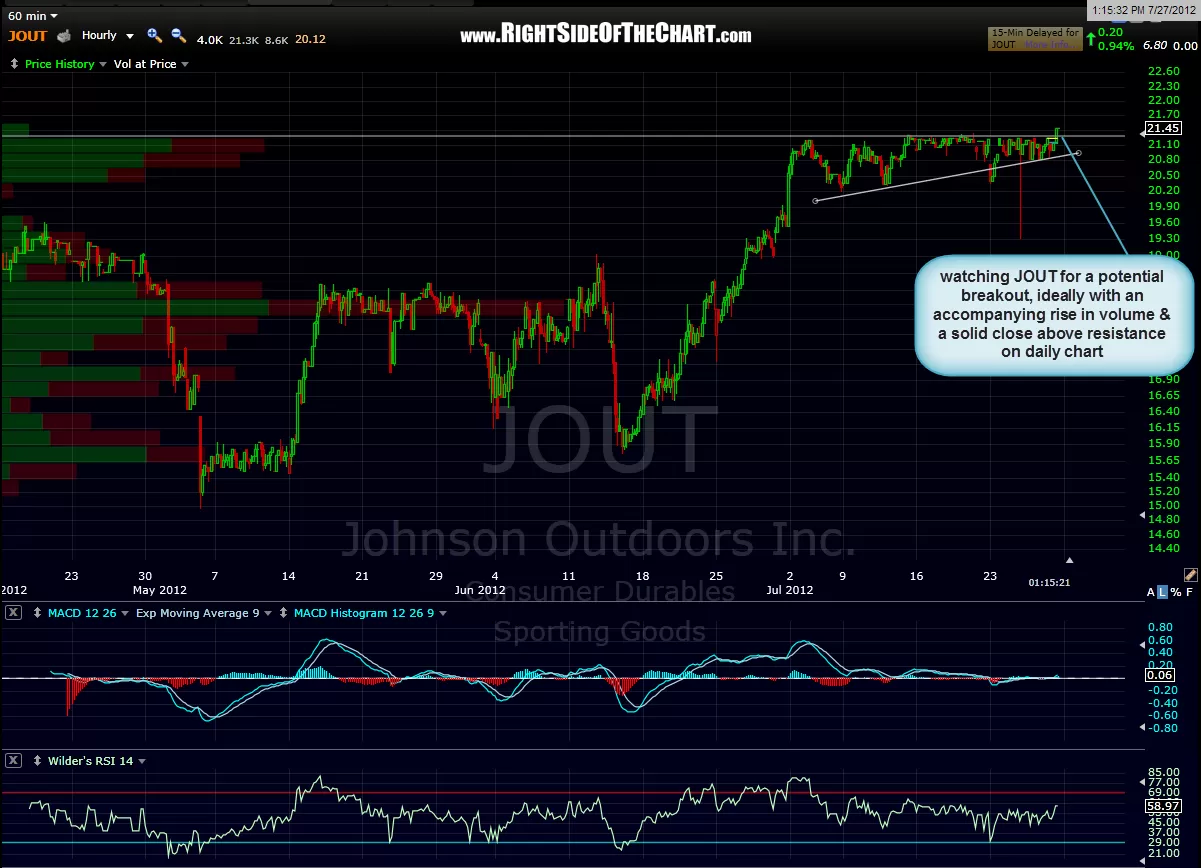
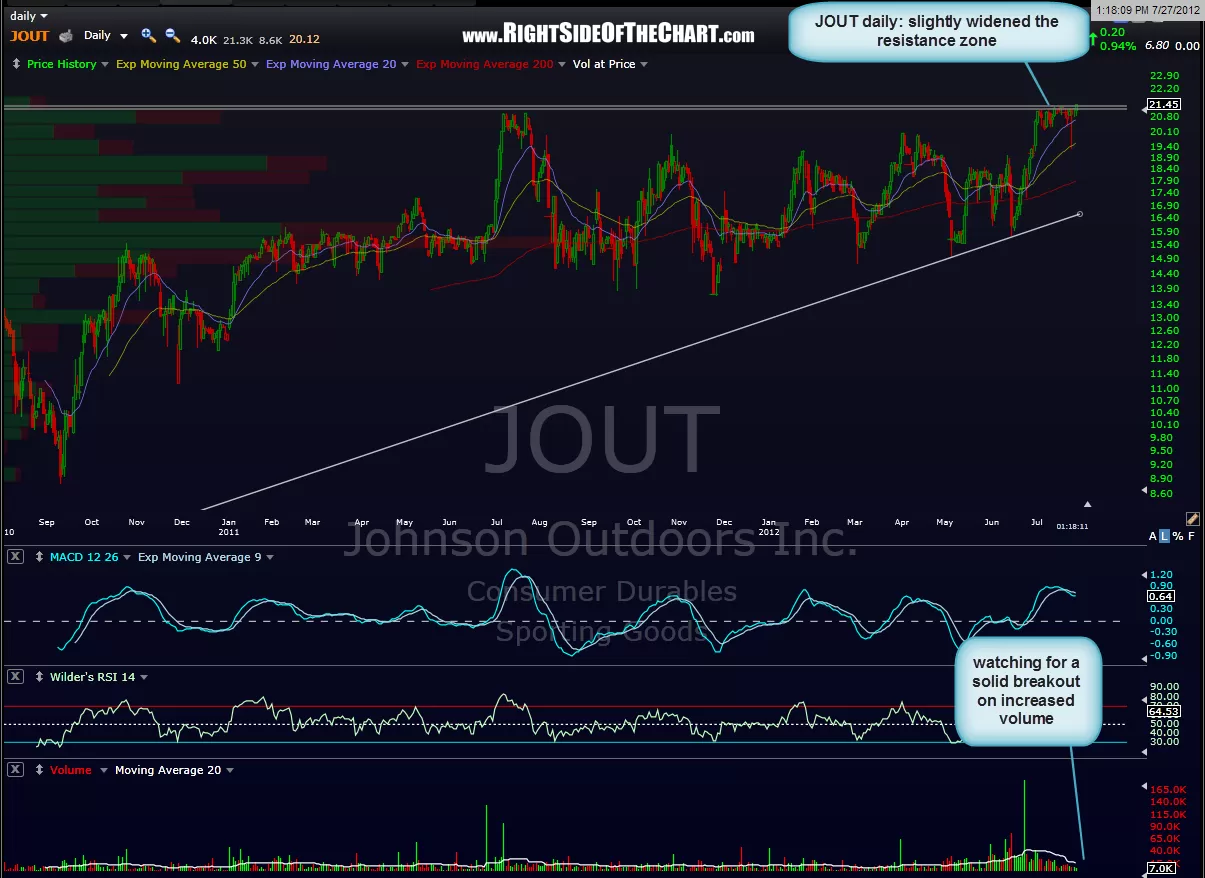
here’s the updated daily chart of JOUT along with a 60 min chart showing what looks like an ascending triangle pattern building energy just below that key resistance area mentioned before. i added another parallel resistance line since the previous chart to create more of a resistance zone. JOUT tends to poke it’s head above resistance areas somewhat often and on low volume (it is a thinly traded stock to begin with). in fact, it has slightly popped above the top of the ceiling that it’s been bumping against for weeks now but with JOUT’s history (i’ve traded this stock for a while and still own as a long-term trade across several accounts), i’d suggest waiting until it makes a solid break above the recent highs and preferably, on above average volume. therefore, i will still consider this only a trade setup for now but watching closely. notes and previous charts can be viewed by clicking on the blue symbol (JOUT) at the bottom of this post.

Results for {phrase} ({results_count} of {results_count_total})
Displaying {results_count} results of {results_count_total}