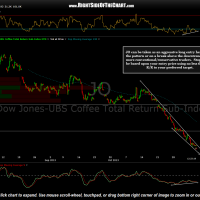
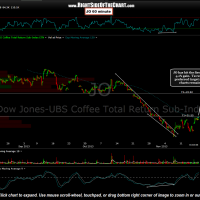
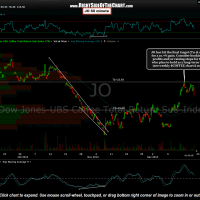
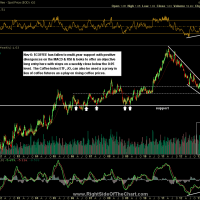
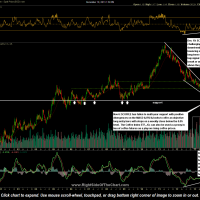
The JO (iPath DJ UBS Coffee ETF) has hit the final target (T2 @ 22.92) for a 10.7% gain. Consider booking full profits and/or raising stops for those who plan to hold as a long-term trade. The previous & updated 60 minute charts as well as the weekly charts of $COFFEE (spot coffee prices) below illustrate how using multiple time-frames can be used successfully to “catch a falling knife” as this trade was entered less than 2% from the bottom of a vicious bear market that chopped off about 2/3rd of the value of spot coffee prices.
- JO 60 minute- Nov 6th
- JO 60 minute- Nov 18th
- JO 60 minute- Dec 19th
- $COFFEE weekly- Nov 6th
- $COFFEE weekly- Dec 19th
Although it is still too early to declare with confidence that the bear market in coffee prices is over and that this is anything but a counter-trend bounce, the recent price & volume action as well as other bullish technicals highlighted on the $COFFEE weekly chart do help support such a case. As stated in the original post on Nov 6th, the JO trade (as well as coffee futures for those preferring a pure play on coffee prices) still has the potential to morph into a longer-term swing or trend trade. As previously stated, the 2nd target on the JO trade based off the 60 minute time frame was my final target for this trade and as such, the JO trade will now be moved to the Completed Trades category. However, JO (and $COFFEE) will remain as Trade Setups in both the Long (typical swing trades) and Long-Term Trade categories.
Those who are longer-term bullish on coffee prices may therefore decide to hold some or all of their position here while raising stops to protect profits. The next buy signal for both JO and/or coffee futures remains on a solid break or weekly close above the weekly falling wedge pattern on $COFFEE. Waiting for prices to print a weekly close above the downtrend line helps to minimize the chances of chasing a false breakout but could also lead to a less-than-optimal entry should prices explode higher during the week following a breakout. Therefore, each trader must decide whether to take an intra-week breakout or wait for a weekly close above a resistance level/buy-point when trading off the weekly charts. Something that I will look for if taking a breakout of a weekly chart during the week would be for a breakout on above average volume (at least 1.5x the average volume for the last 60-90 days) as well as any other bullish price action, such as a bullish reversal candlestick pattern on the daily frame.


