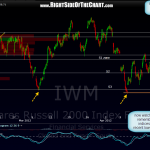
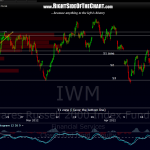
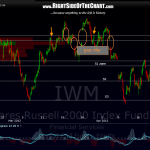
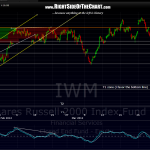
recent string of IWM 60 minute charts in chronological order as posted. i noted the critical support level on the recent (last) chart which corresponds to that key level that i’ve been discussing on the SPY 60 min. remember, just like when the SPY broke a key level to the upside recent, all the other key indexes we’re still at or below key levels and therefore, dragged the SPX back down below that level. likewise, if IWM or maybe the SPY breaks that key support level, we must also see the other major indexes break support before getting too aggressive on the short-side as i’ve often seen one or two indexes break down, sucking in the shorts and shaking out the longs, only to have a sudden and sharp reversal to the upside as another key index that was trailing behind finds support and bounces off it’s comparable key support area. that does not mean that one can’t be short here or add on a break of support by one of the indexes, just to keep an eye on all indexes and their respective support levels, even if you exclusive trade the SPY or the Q’s, for example.
Results for {phrase} ({results_count} of {results_count_total})
Displaying {results_count} results of {results_count_total}


