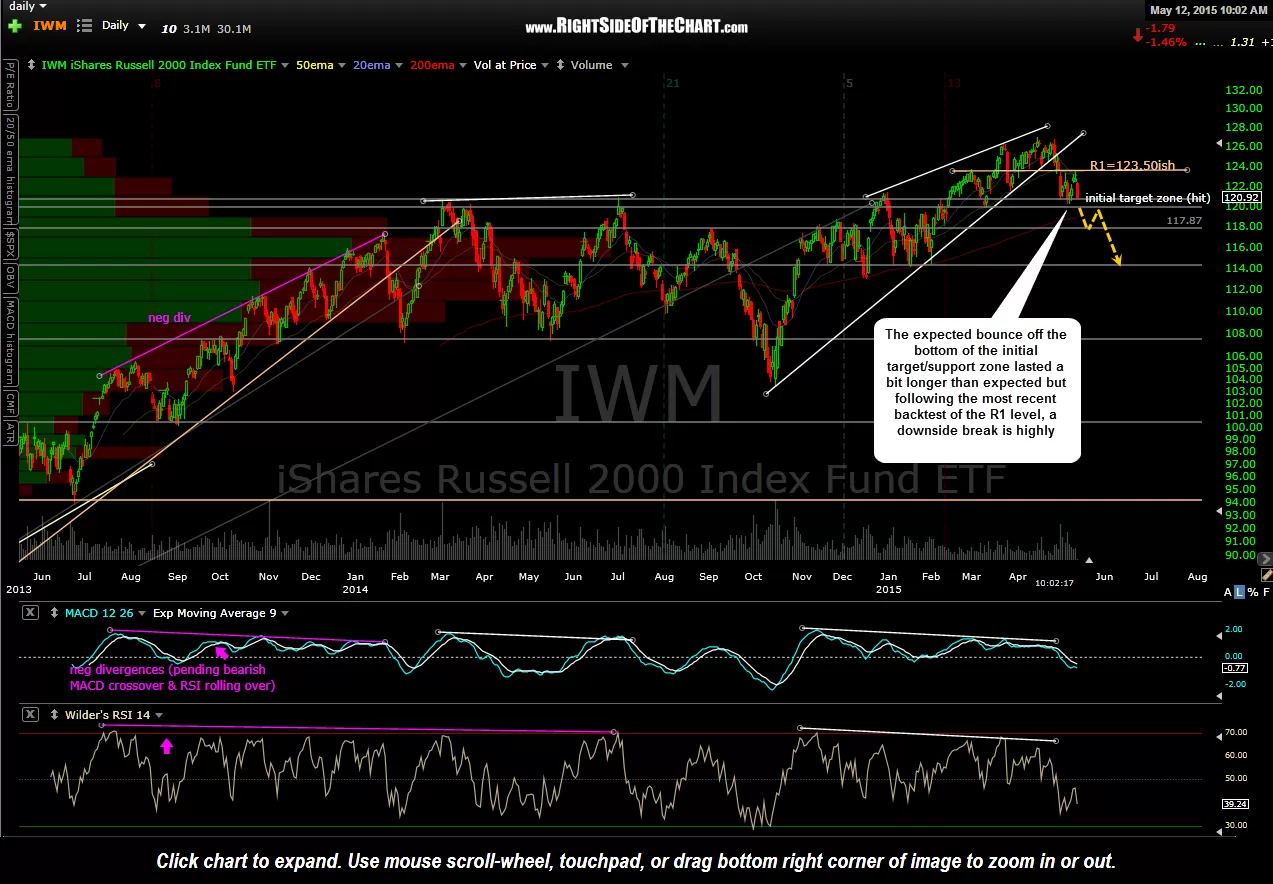
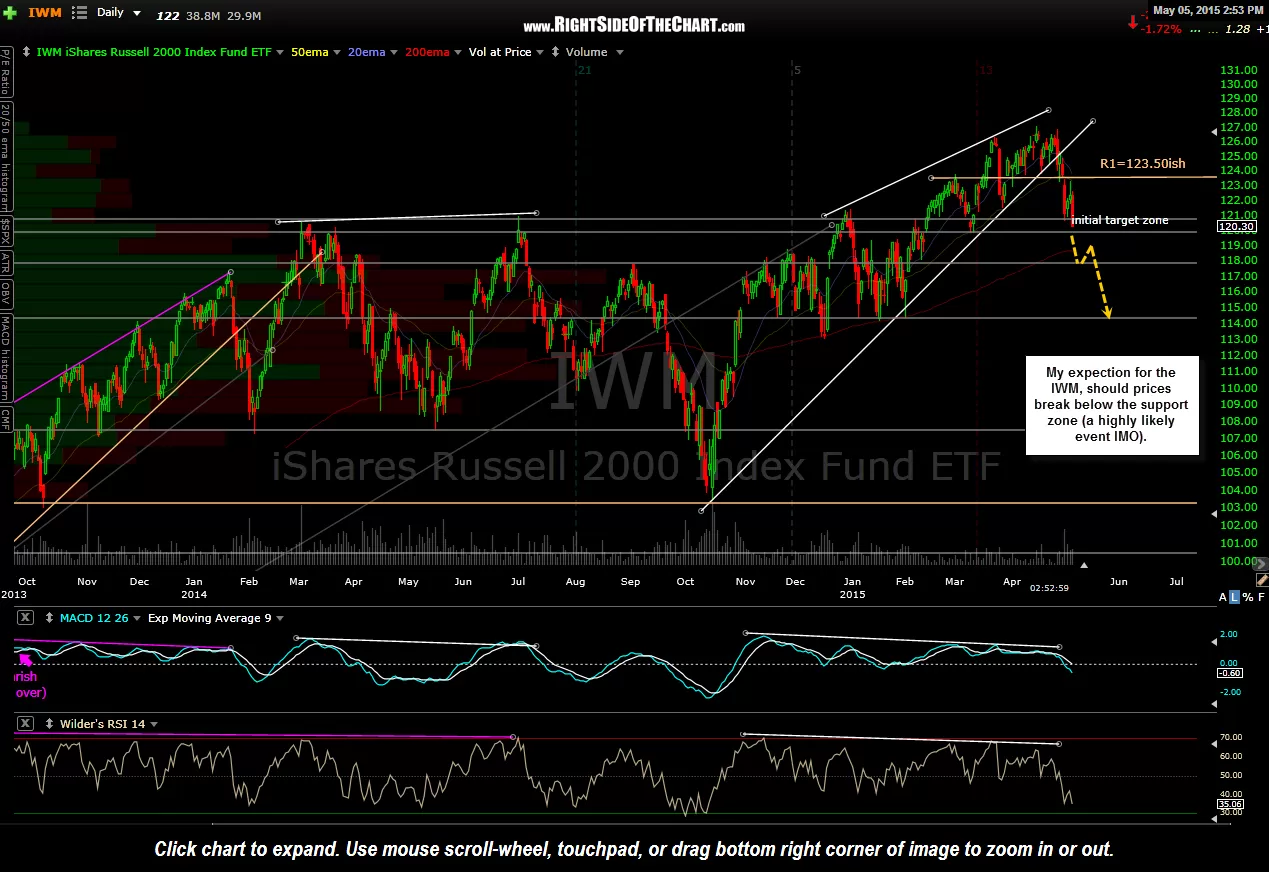
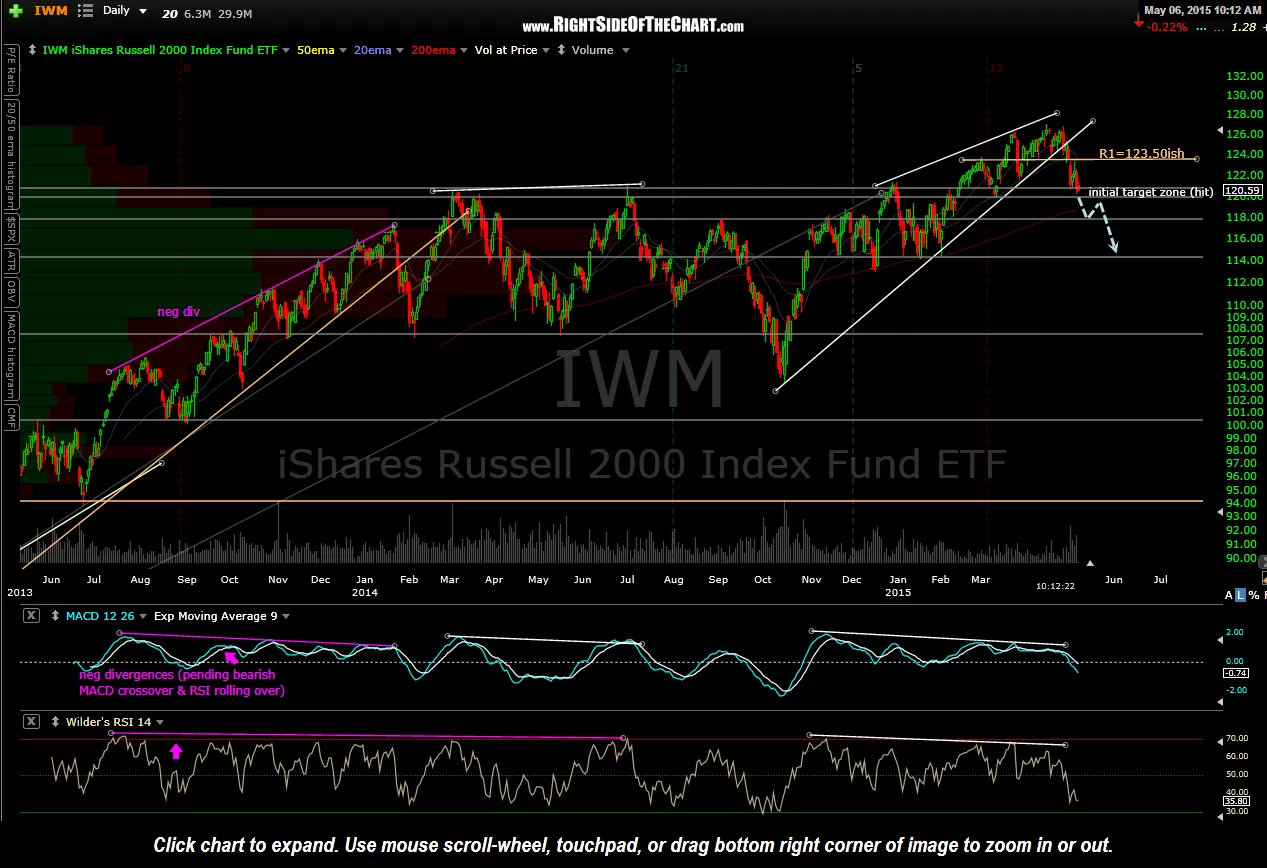
The expected bounce off the bottom of the initial target/support zone lasted a bit longer than expected but following the most recent backtest of the R1 level, a downside break of that key support level is highly likely to occur this week. The previous & updated IWM daily charts are below, providing a quick visual on how this correction, which is still likely in the early stages, has played out so far. I had thought that the May 6th tag of the support zone would be the final tag before the small caps broke below & began the next thrust lower but from there prices bounced to once again backtest the 123.50ish support which only served to further clear any near-term overbought conditions, thereby adding additional fuel for a potentially more impulsive & lasting move lower once prices clearly break below the bottom of the support zone.
The scenarios outlined below show a reaction off the 117.90ish level but the fact that IWM has consolidated between the initial target zone & the R1 resistance level for nearly two weeks now increases the chances that the Russell 2000 may just slice right thru that level without a reaction. Next major support/target is that horizontal line around the 114.35 level.
-
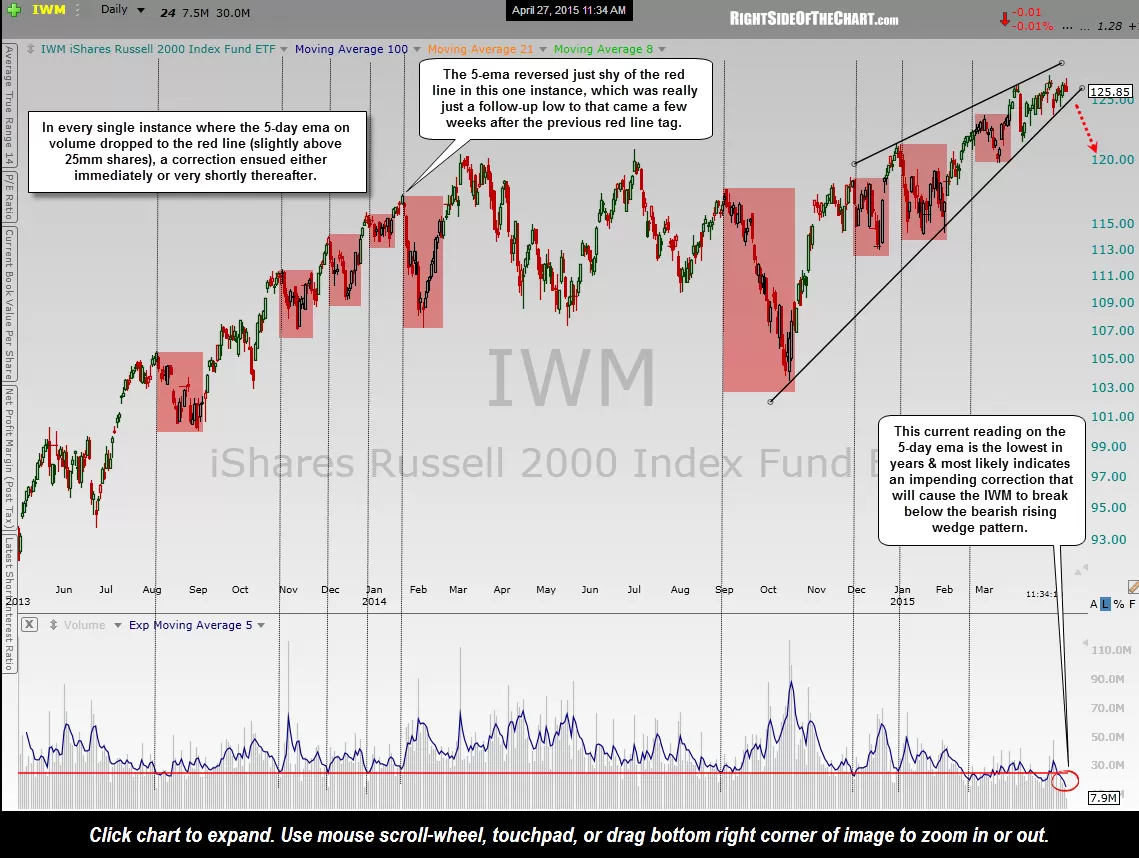
- IWM low volume sell signals April 27
-
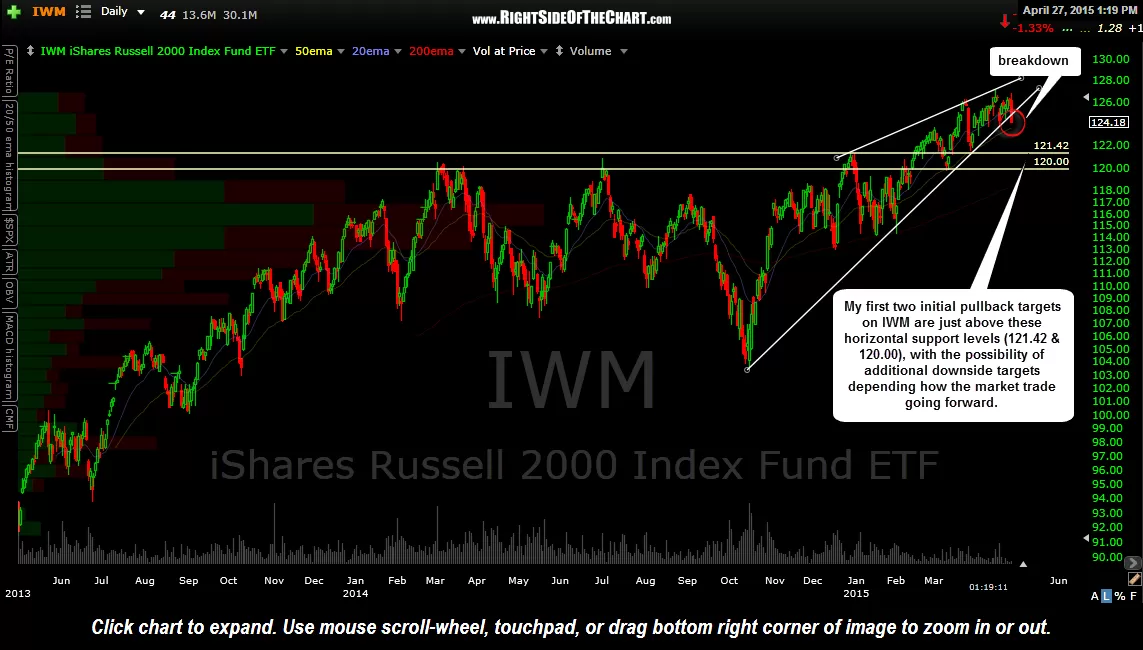
- IWM daily April 27th
-
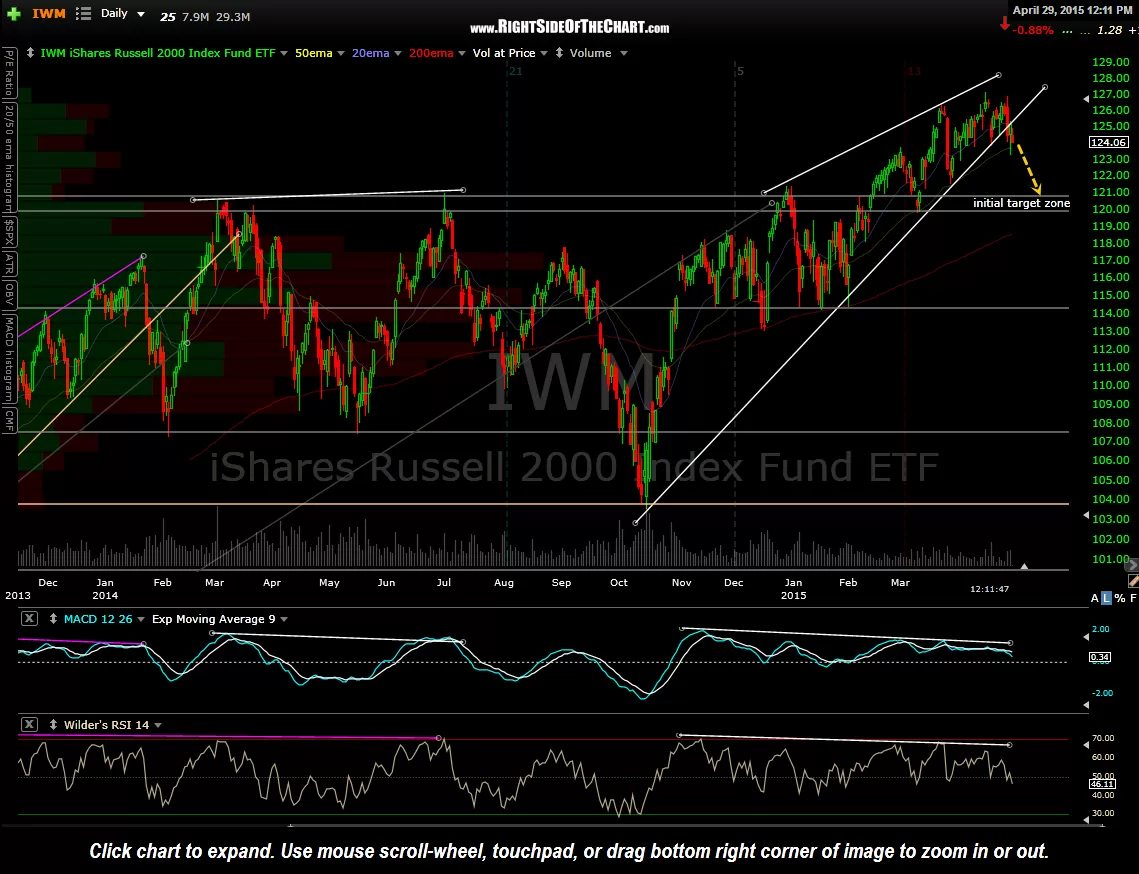
- IWM daily April 29th
-
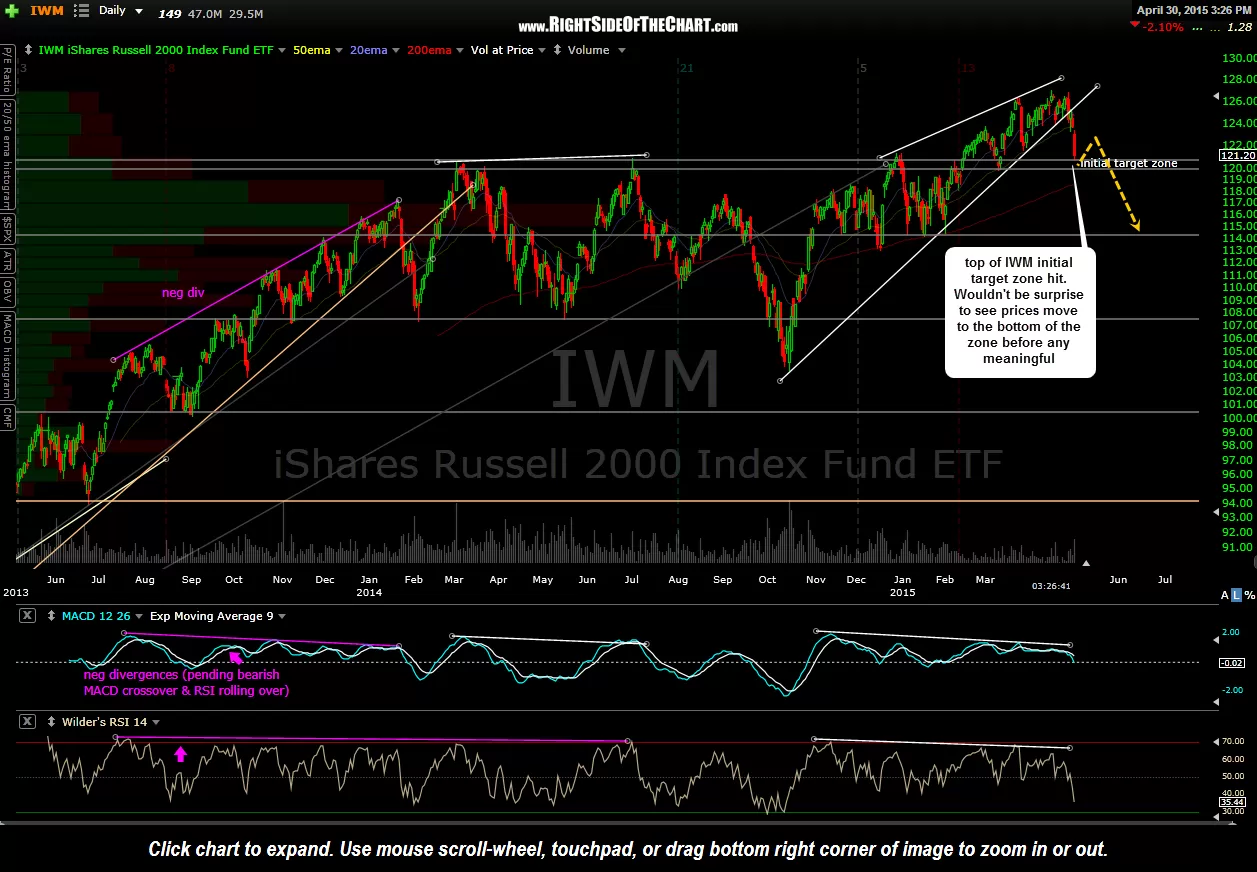
- IWM daily April 30th
-
- IWM daily May 5th
-
- IWM daily May 6th
-
- IWM daily May 12th