
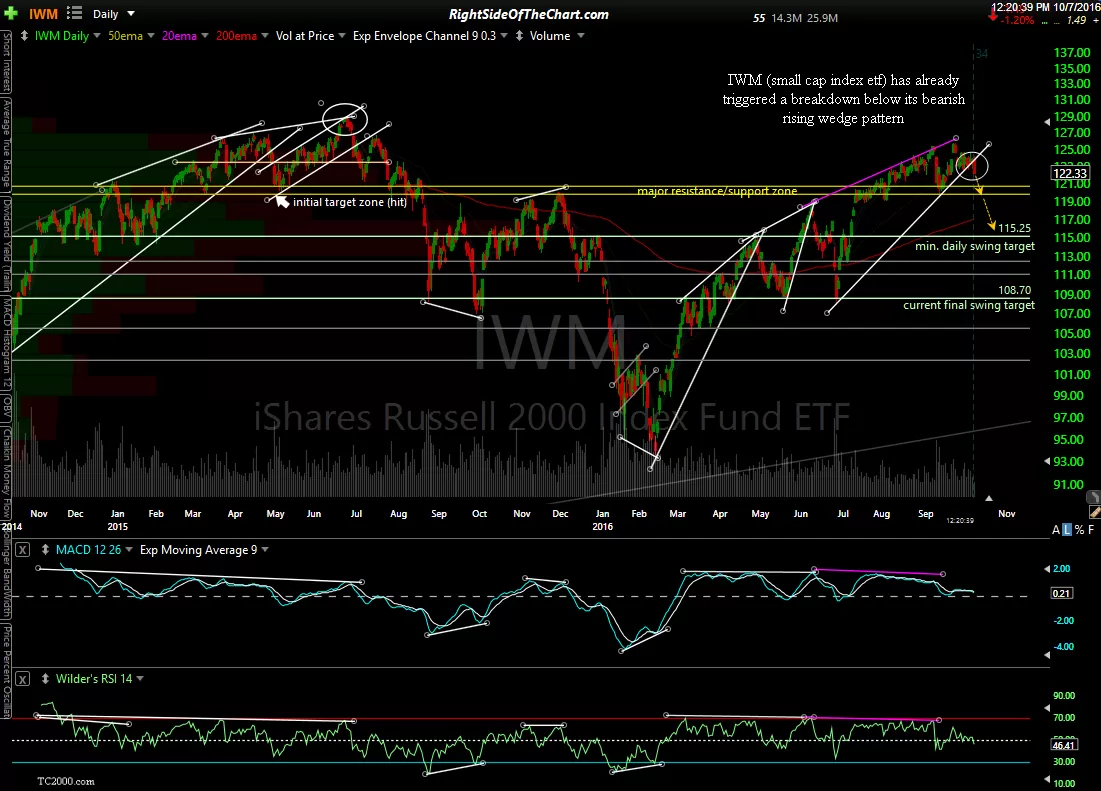
Someone just mentioned the relative strength of the small caps compared to the large cap indices ($SPX, $NDX, etc..) in the trading room. Today’s rally in the Russell 2000 Index is simply the expected reaction off the first tag of major support/downside target that I’ve been highlighting for months now as shown in the first chart below that was posted a month ago right after IWM had triggered a solid sell signal on a very impulsive breakdown below its bearish rising wedge pattern (first chart below).
-
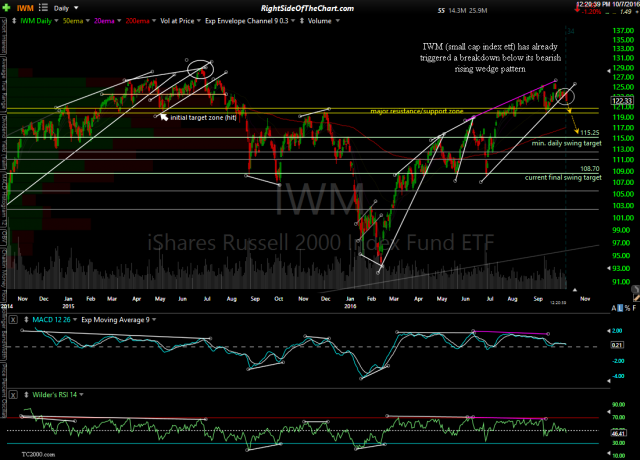
- IWM daily Oct 7th
-
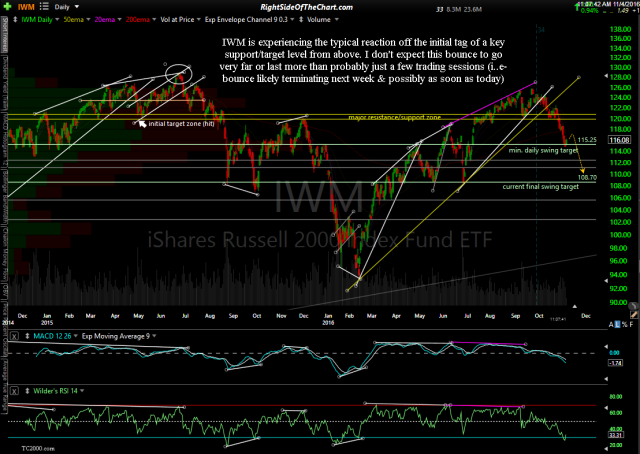
- IWM daily Nov 4th
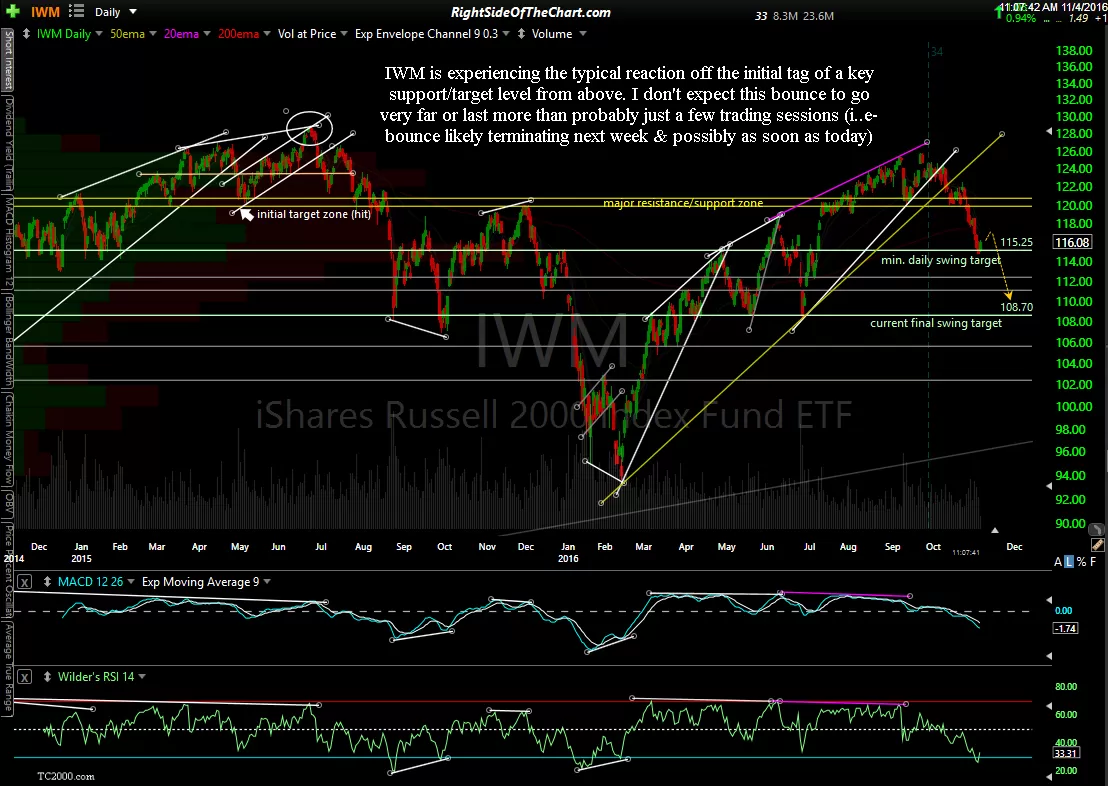
With IWM down over 8.5% since the Sept 23rd peak (vs. drops of less than 5% on both SPY & QQQ from their respective recent all-time highs), the small cap were much more oversold & fell a lot more than the large caps so this is simply an oversold-off-support bounce that probably won’t go very far or last more than a few sessions IMO. Note how well that scenario from October 7th played out with the only reaction since that breakdown occurring exactly where expected & a relatively muted one as also expected. Sometimes I’ll draw the bounces with the dashed lines or arrow but when I stop and arrow for a projected rise or fall, such shown on the first chart above, that means a minor reaction is expected at that level, followed by a continuation of the trend. IWM experienced a relatively minor & brief bounce off the bottom of that yellow support zone & went on to continue the impulsive move down to the first minimum daily swing target which is a more significant support level although based on the outlook for the broad markets as a whole, I don’t not expect a very sharp or lasting rally in IWM at this time.