Member @morrienelson had just pointed out the recent relative weakness in IWM & inquired about potential price targets. IWM is at the bottom of my minimum target/support zone (posted on the recently IWM 60-minute charts over the last two months) while at oversold readings which typically precede a bounce. Oversold can certainly become “more oversold” so if this support zone does not hold, my expectation would be for a move down to at least the likely target zone (117-117.50). This 120-minute IWM chart shows those oversold reading (circled on the RSI & prices above) and the subsequent price action. As such, it would be prudent not to add any short exposure to IWM at this time, at least until a bounce back into decent resistance or a break below those recently highlight critical support levels on the major indices such as SPY & QQQ.
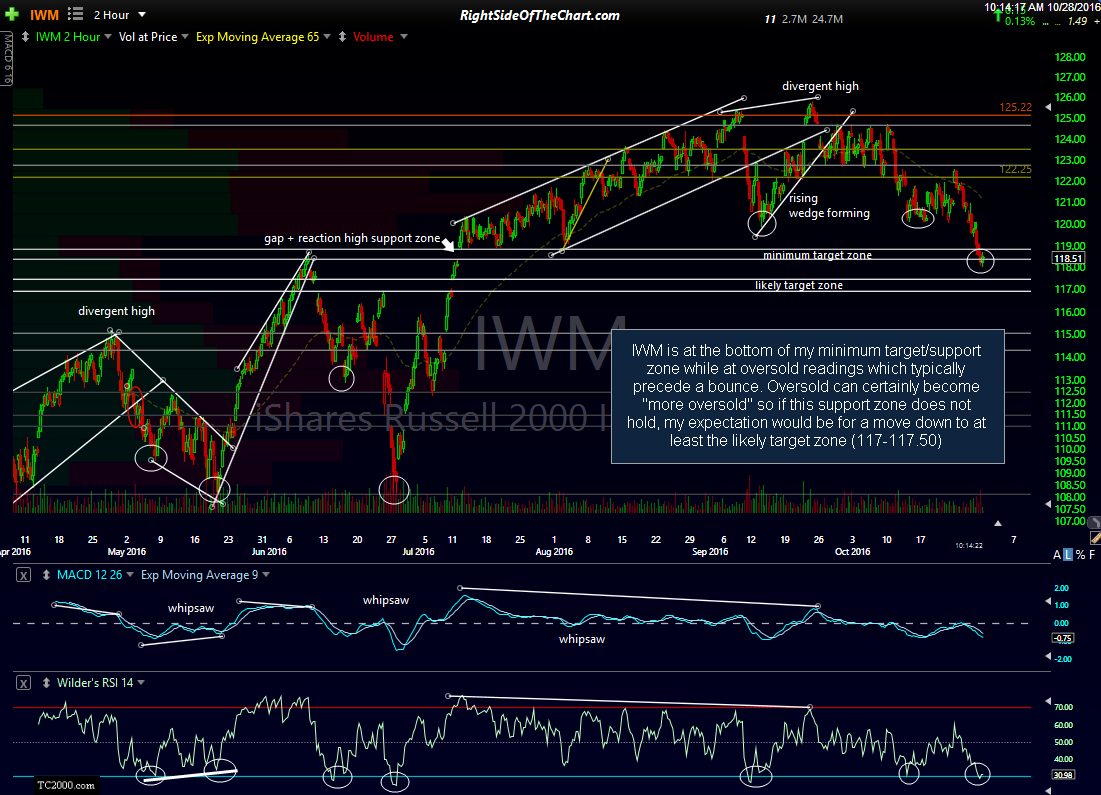
IWM 120-minute Oct 28th
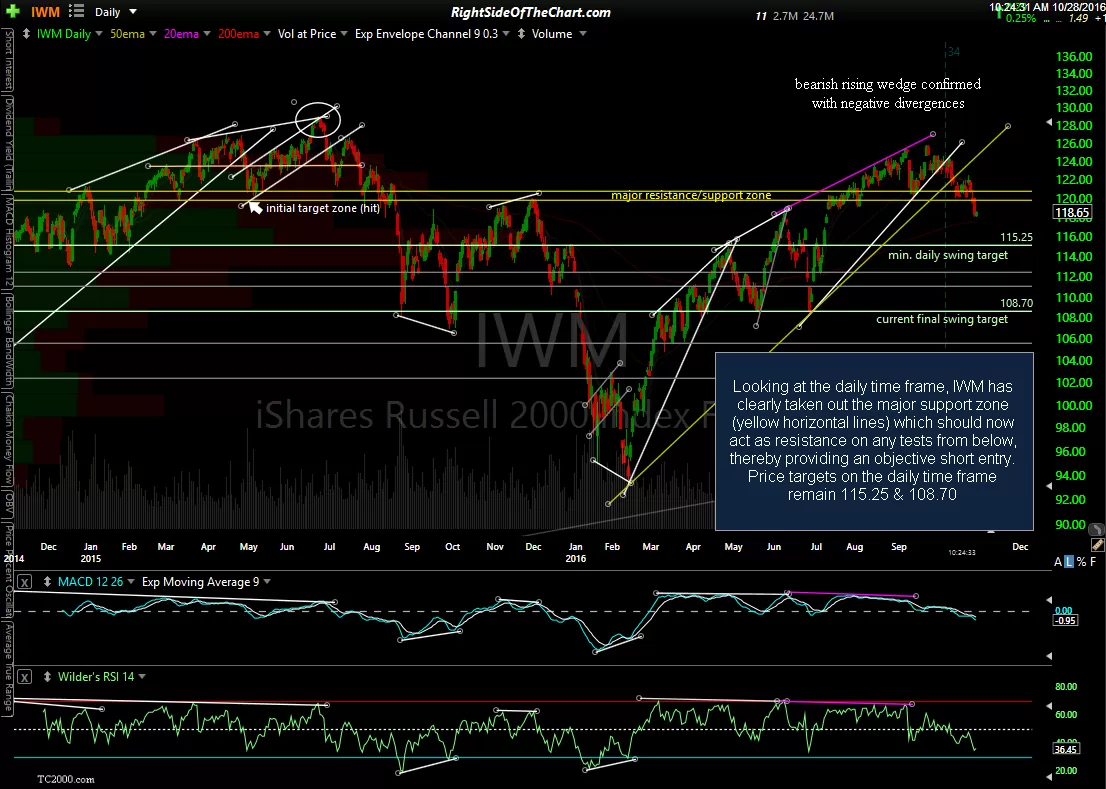
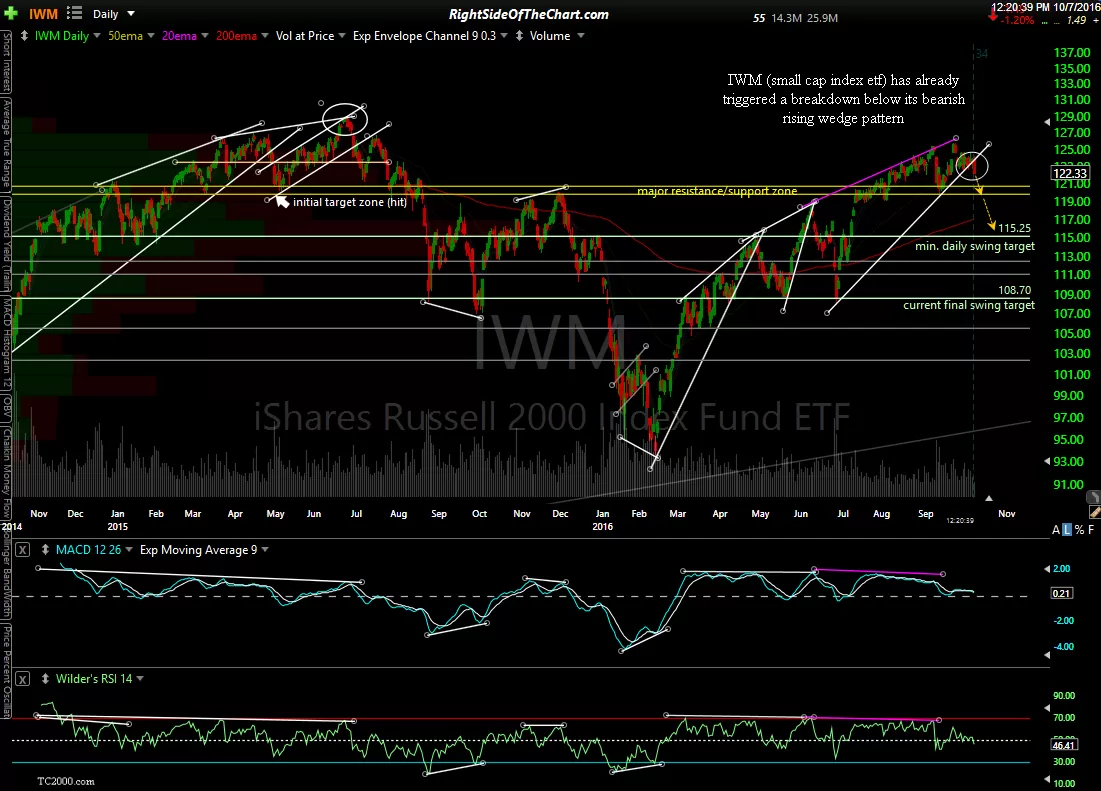
Looking at the daily time frame, IWM has clearly taken out the major support zone (yellow horizontal lines) which should now act as resistance on any tests from below, thereby providing an objective short entry. Price targets on the daily time frame remain 115.25 & 108.70. Previous daily chart posted 3-weeks ago & updated the daily chart of IWM below:
-
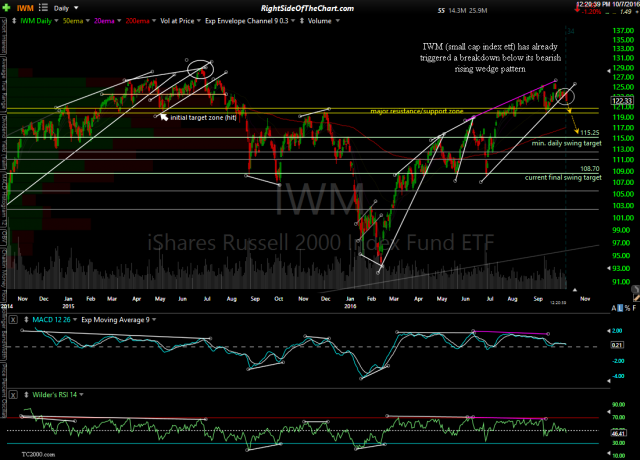
- IWM daily Oct 7th
-

- IWM daily Oct 28th