
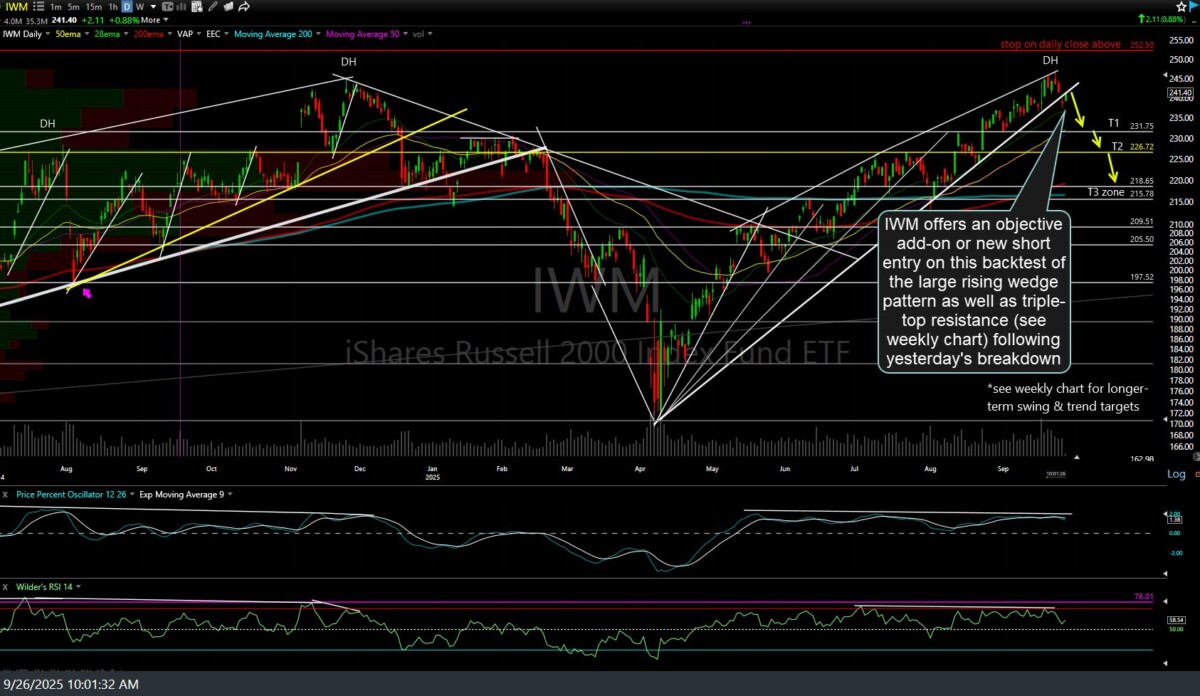
While IWM (Russell 2000 Small-cap Index ETF) has been highlighted in recent videos, including yesterday’s breakdown below the large bearish rising wedge pattern (defined by the uptrend line off the April lows) as well as rallying into long-term (triple-top) resistance on the weekly chart, I’ve marked up the daily chart below with some typical (multi-week/month) swing trade targets as well as a suggested stop, making it an official short swing (and trend) trade.
IWM daily Sept 26th
IWM offers an objective add-on or new short entry on this backtest of the large rising wedge pattern, as well as triple-top resistance (see weekly chart), following yesterday’s breakdown. The daily chart above, for typical swing traders, lists three price targets with the third & current final target zone coming in around the 200-day moving averages. For longer-term swing & trend traders, my longer-term targets remain as previously highlighted on the weekly chart.
My preference for a long-term swing or trend trade targeting a drop of 50%+ on IWM would be to take a starter (¼-½) position here, adding on either an impulsive rejection off the trendline & this triple-top resistance and/or a solid move & weekly close back down below 245, should IWM break out above this long-term resistance level. Stops on a long-term swing or trend trade should be commensurate with one’s average entry price & preferred price target(s), ideally using a favorable R/R of at least 3:1 or better.