
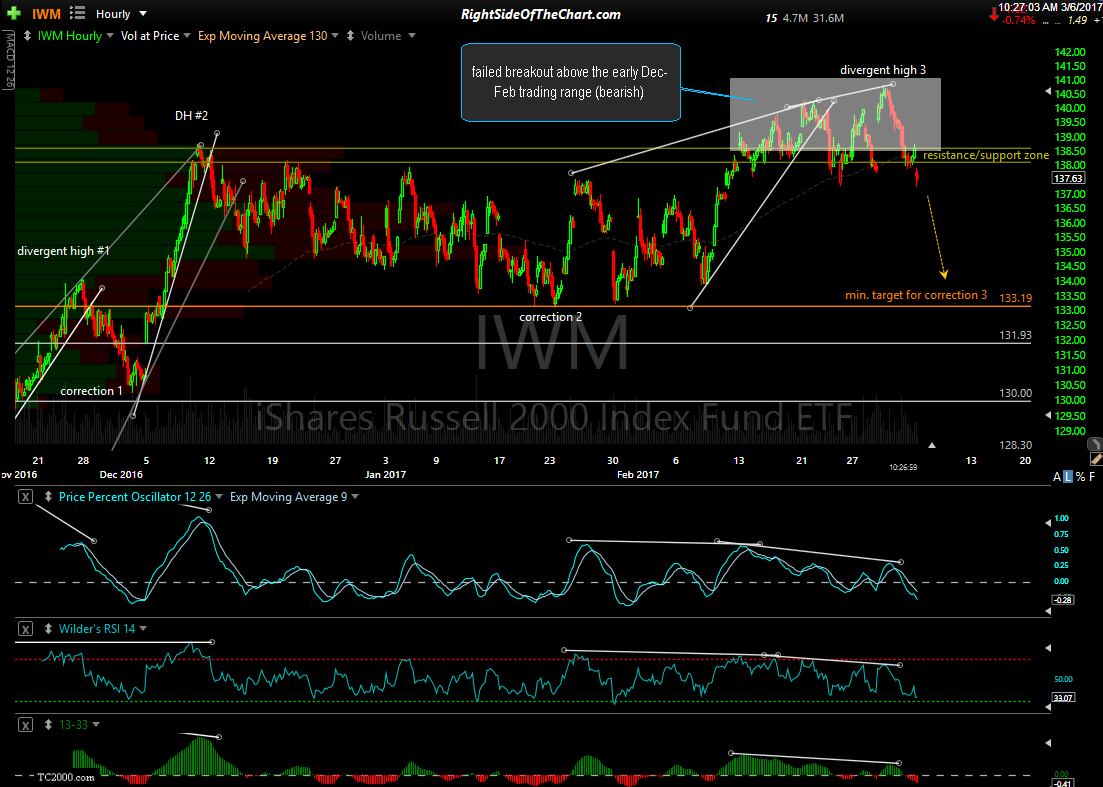
My minimum correction target has been hit with the typical reaction off that key support level, which is the bottom of the trading range since early December. So far a typical oversold, counter-trend bounce that hasn’t even made it to the 38.2% Fibonacci retracement of the move down off the highs yet. 60-minute charts below are the previous chart posted back on March 6th followed by today’s updated 60-minute chart.
-

- IWM 60-min March 6th
-

- IWM 60-min March 23rd

The catalyst for this rally was two-fold:
- First & foremost, IWM was extremely oversold on the near-term time frames & bounced off the initial tag of key support, the bottom of the trading range as initial tags of support levels that haven’t been visited in a while almost always produce at least a minor reaction.
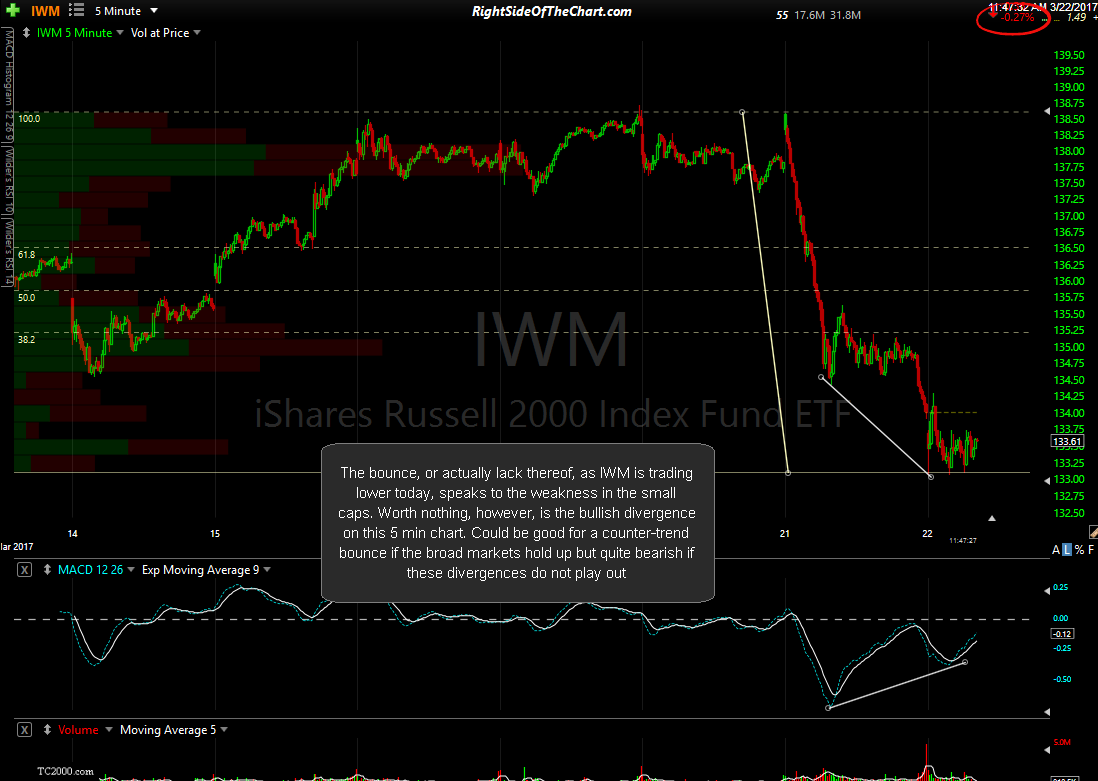
- The positive (bullish) divergences highlighted yesterday on the 5-minute time (first chart below) did end up playing out, with IWM might one slightly lower low following that update, with the divergences still very much intact at that low.
-

- IWM 5-min March 22nd
-
- IWM 60-min March 23rd
-
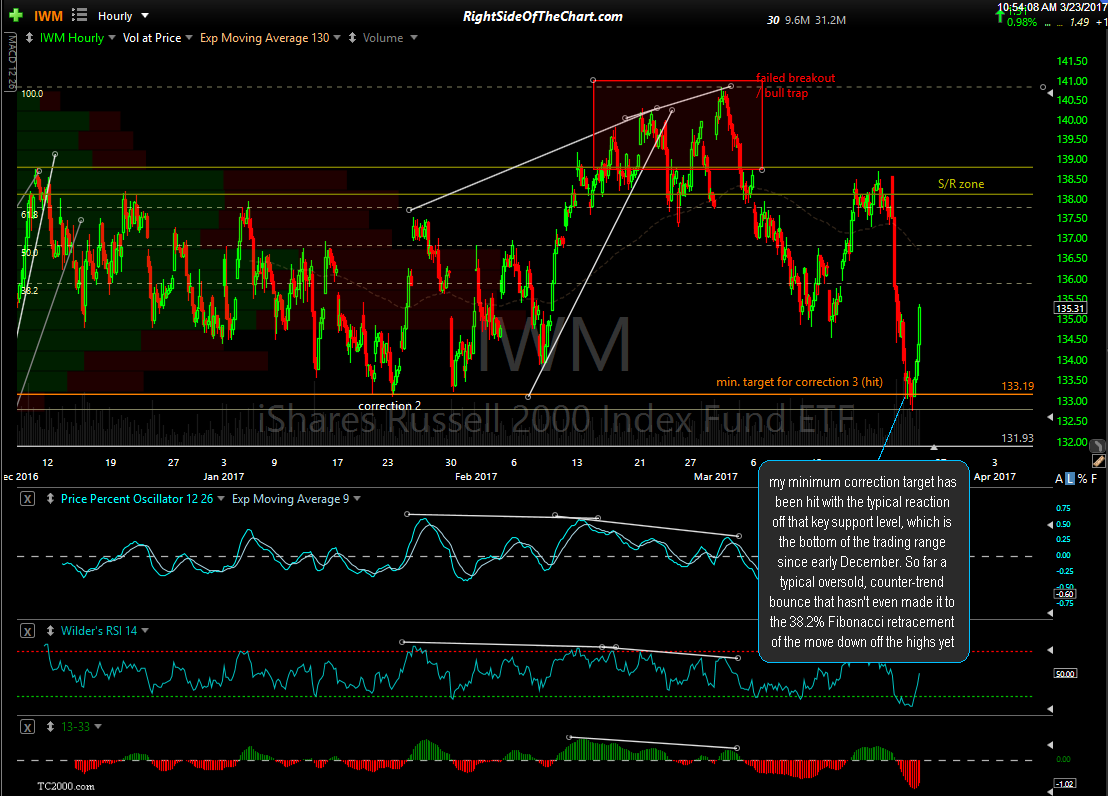
The fact that IWM hit key support on the 60-minute time frame with bullish divergences in place on the 5-minute time frame combined as the catalyst for what so far appears nothing more than a typical oversold, counter-trend bounce off support. Hard to say how much more upside, if any, is left but my best guess would be a reversal on or before the 38.2% Fibonacci retracement of the move down off from the March 1st highs. That level comes in around 135.90.
Personally, I did not, nor have any intention of covering my Russell 2000 short position as the longer-term charts, particularly the daily charts, indicate that this is most likely a counter-trend bounce in a larger correction with more downside to come soon.