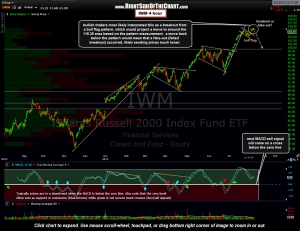
 A follower of the site asked me to share my thoughts on IWM. Here’s an updated 4 hour chart showing what appears to be a fairly clear looking bull flag pattern, of which prices recently broke to the upside. A common measurement for a flag pattern is to add the length of the “flagpole” to the point where the breakout of the pattern (top of the flag, in the case of a bull flag) occurred. This would give a measured price target of roughly 116.30. However, the noticeable lack of volume on the breakout increases the odds that the breakout will fail, hence becoming a bull trap for those who positioned long on the breakout. If prices move back below the flag, I wouldn’t be surprised to see IWM to quickly continue lower until at least the 99.75-100 area.

