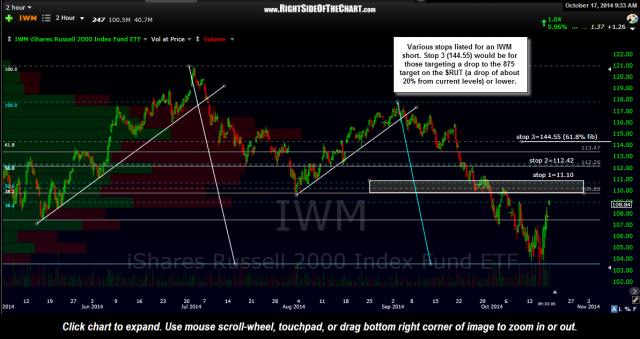
Here are a few suggested stop levels for the IWM short trade. The first stop would be just above that shaded box which encompasses the 109.80 horizontal resistance as well as a Fib cluster, the 38.2% & 50% retracement levels of the two prior reaction highs. The next stop, stop 2 at 112.42 lies just above the 112.20 horizontal resistance and another tight Fib cluster (50% & 61.8%) with the upper-most suggested stop above 144.55, which comes in around the 61.8% retracement of the move down from the July 1st peak in the $RUT/IWM. Which stop(s) one uses would be based on their preferred downside target(s) in the $RUT/IWM (i.e.- the lower your price target, the higher your stop).
I had mocked up a daily chart of IWM with some potential target areas last night but either inadvertently saved it to the wrong watch-list or didn’t save it at all. If I can’t find it I’ll work up another chart today but as of now, based on my interpretation of the weekly chart, I think a move down to the 875 level on the $RUT (about a 20% drop from current levels) is certainly a possibility in the coming months at this time. Of course, if that proves to be the case, we would almost certainly experience some very quick counter-trend rallies along the way.


